
Barbara Reinhard, CFA
Senior Managing Director, Chief Investment Officer, Multi-Asset Strategies and Solutions
Overview of target date funds: Different paths toward a common goal
For plan participants, target date funds simplify the complex task of saving and investing for retirement by automatically allocating assets based on each individual’s age and retirement date.
For plan sponsors, evaluating target date funds is anything but simple. Divergent investment methodologies across target date funds have delivered dramatically different results over time. As a result, it is critical for plan fiduciaries to understand these differences in order to select the fund that best matches the needs and characteristics of their plan and its participants. We believe this evaluation process should focus on four key components.
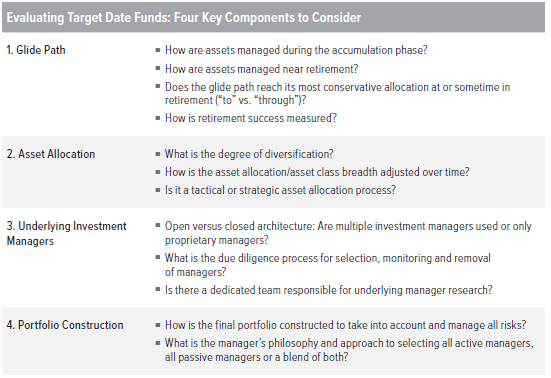
In the following sections, we explain how Voya approaches each of these four components to build holistic solutions that help prepare investors for a successful retirement.
Glide path design
Meaningful differences in equity allocation among target date managers lead to significant differences in performance.
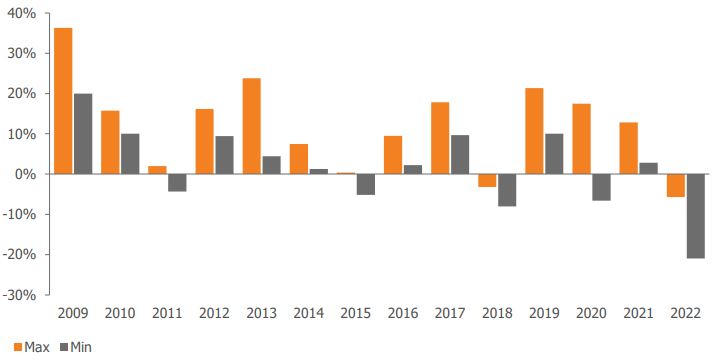
Glide path design is the primary determinant of risk and return in target date funds (TDFs) throughout a life cycle. Each target date manager utilizes a proprietary glide path methodology, leading to a wide dispersion of equity allocations across the industry. In 2022, the range of total equity allocations between the most aggressive and conservative glide paths was about 40 percentage points for participants five years from retirement (Exhibit 1). As Exhibit 2 highlights, these significant differences in equity allocations are key contributors to the wide dispersions in performance among target date providers.
Exhibit 1. Meaningful differences in equity allocations among TDF managers…
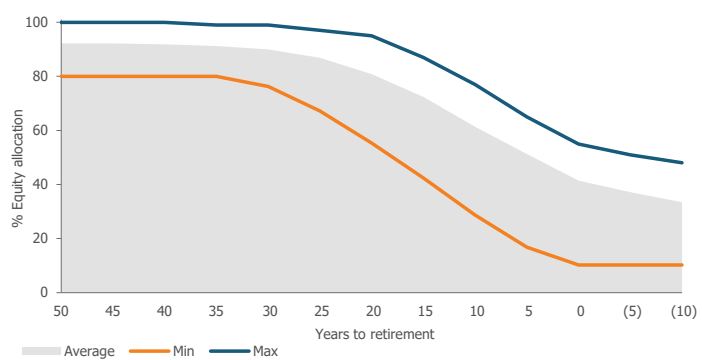
Exhibit 2. …Lead to significant differences in performance
Calendar Year Range of Returns for 2025 TDFs
So, what is the optimal mix of equities and bonds throughout a target date life cycle? When constructing a glide path, we believe it is critical to evaluate participants’ two sources of wealth: labor income (salary and wages) and retirement account 401(k) balance.
Voya’s glide path has a higher-thanaverage equity allocation for younger participants and a lower-than-average equity allocation for participants near and in retirement.
Exhibit 3. The two sources of retirement funding shift over time
Hypothetical Example
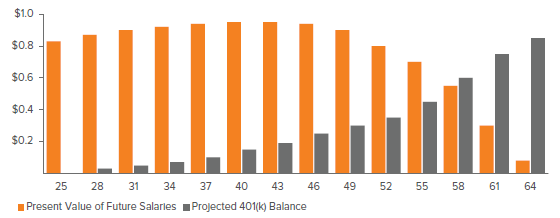
As Exhibit 3 shows, the proportion of wealth contributed by these two sources — income and retirement account balance — shifts over time and, as a result, impacts the shape of our glide path. Our glide path is structured not only to reflect this relationship between income and the retirement account balance, but also the expected risk-adjusted returns for equities and bonds. Historically, equities have produced higher returns than bonds and cash over long periods of time (Exhibit 4). Of course, allocations to equities also expose investors to more volatility.
During the accumulation phase, a participant’s longer investment horizon provides greater capacity to withstand portfolio volatility since there is more time to recover from losses. Participants in the accumulation phase also have another buffer against volatility — their income profile. The present value of lifetime expected income is the primary source of wealth in the accumulation phase. This present value has bond-like characteristics that allow steady contributions through market downturns, which helps participants add to their holdings at a deep discount. In other words, steady contributions allow the participant to dollar cost average into the target date funds, which significantly increases potential returns for participants as markets recover. Finally, participant account balances at this stage tend to be low, so losses are limited. For these reasons, we believe that it is appropriate for glide paths to have aggressive equity allocations at the onset of a participant’s career to help maximize expected return at a time when participants are well positioned to withstand expected market volatility.
Exhibit 4. Equities have delivered higher historical returns with higher volatility
1928–2022
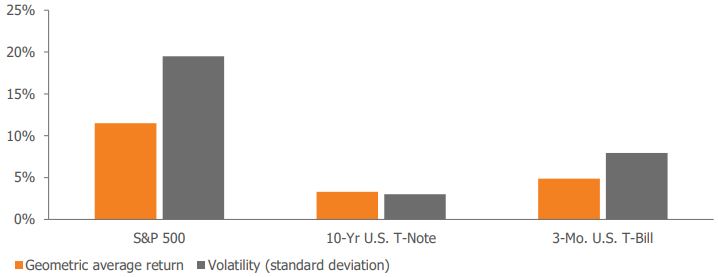
Sources: Federal Reserve Bank of St. Louis, Bloomberg. Past performance is no guarantee of future results.
A glide path with a conservative equity allocation near and during retirement is critical to protecting a career’s worth of accumulated wealth.
As retirement approaches, the present value of a participant’s income rapidly declines, both on an absolute basis and relative to the participant’s projected retirement account balance. At retirement, income is discontinued and the retirement account balance becomes the participant’s primary source of wealth. During these later years, the participant is far more vulnerable to market downturns. The ability to counter portfolio losses with future contributions is greatly limited because remaining expected income is small relative to the size of the retirement portfolio. These circumstances warrant a rapid decline in equity allocation as retirement nears.
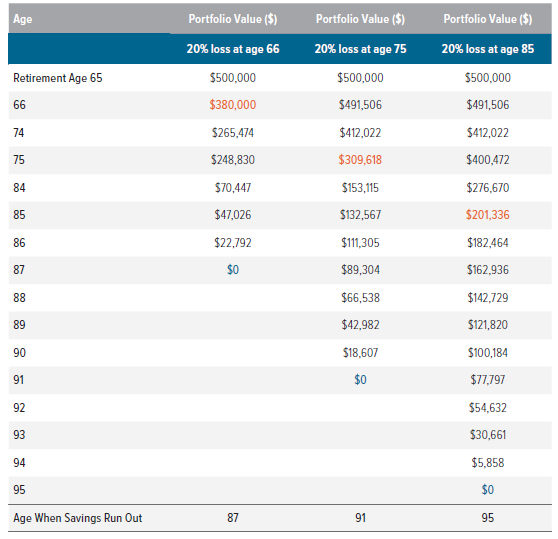
As a participant enters retirement, avoiding “sequence of return” risk should be a primary driver of the glide path design. Participants are the most vulnerable to sequence of return risk — the risk of selling during or immediately after periods of poor performance — the day they retire, for a number of reasons: income (contribution) has discontinued, withdrawals have begun, and participants now have the longest period of time to support their retirement spending without steady income from employment. As a result, a significant market downturn in the early years of retirement has a far greater impact on the longevity of assets than at any other time in a participant’s retirement. To illustrate this risk, Exhibit 5 shows a hypothetical scenario of three investors who have the same average rate of return throughout retirement but experience a 20% loss at different ages (age 66, 75 and 85). As Exhibit 5 shows, a retiree who experiences a 20% loss at age 66 depletes his or her assets almost 8 years earlier than a retiree who experiences a 20% loss at age 85.
Exhibit 5. Investment losses have a disproportionately negative impact on younger retirees
We believe a conservative “to” glide path structure is the optimal approach to help participants meet their income needs through retirement.
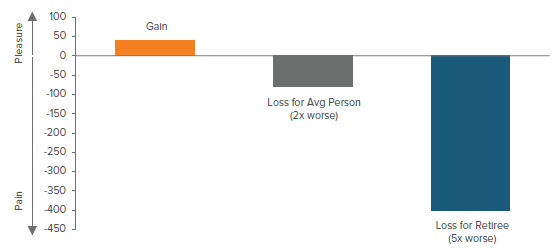
Another critical aspect we consider in our glide path design is loss aversion, one of the key tenets of behavioral finance. As studies have shown, a $1 loss has a greater emotional effect on investors than a $1 gain (Exhibit 6). In fact, the average person feels the pain of a loss twice as much as the pleasure he or she feels from a gain, but retirees tend to weight losses five times more. This behavioral bias is a greater risk near and at retirement, because at that point account balances are likely at their highest levels and a market decline would mean sizeable dollar losses. As a result, investors are more susceptible to selling at market bottoms, depriving themselves of the potential to recoup losses over time. Given the heightened vulnerability to loss aversion and sequence of return risk near and at retirement, we believe a glide path that reaches its most conservative equity allocation at retirement (known as a “to” approach) is the optimal structure to help participants meet their income needs through retirement.
Exhibit 6. People weigh losses more heavily than gains
Perception of benefit/cost in gaining/losing equivalent dollar amount
Measuring retirement success: Income replacement ratio
A final aspect to consider is the overall objective of a glide path: What defines retirement success? Most retirement plan participants have two goals: maintain their lifestyle in retirement and avoid outliving their assets. Therefore, we believe it is important to examine the risk/reward tradeoff of different glide paths in terms of their potential to replace participants’ income.
Income replacement ratio
Income replacement ratio (IRR) is the income generated from retirement assets as a percentage of the participant’s last earned salary. As an example, if participant A earns an average of $100,000 in the years leading up to retirement, a 70% IRR would provide participant A with $70,000 in income every year in retirement. IRR is the preferred measure because it reflects the participant’s post-retirement relative purchasing power as well as his or her ability to meet financial needs in retirement. The IRR assumes that the value of the retirement account will be annuitized at retirement. While not all plan participants will do this at retirement, the IRR is a meaningful measure, as it captures the purpose of the target date fund investment — saving for retirement income.
What sets Voya apart is that we do not believe a glide path should target a predetermined IRR. Targeting a specific IRR can lead to glide paths that are either too aggressive or too conservative relative to participant risk tolerance. For example, if a participant population is not saving enough, we do not believe this savings gap can be closed entirely by a more aggressive glide path. Furthermore, a glide path based on targeted IRRs can be highly sensitive to specific assumptions about market returns and inflation. If return forecasts drop in a given year, then the glide path must become more aggressive to make up for the shortfall. In both examples, targeting a specific IRR may lead to a glide path that is outside participants’ risk tolerance limits.
Instead, we believe a glide path should aim to optimally balance the risk/reward tradeoff of the income replacement ratio for a given level of risk aversion. To accomplish this, we evaluate glide paths based not only on the expected income replacement ratio, as defined by the median IRR over all possible IRR outcomes, but also on the shortfall risk, as defined by the average of the five percent of worst-case IRR outcomes. This approach takes into account that, at a certain point, higher levels of IRR exhibit diminishing benefits relative to the additional risk assumed. There is a point at which the incremental benefit of a higher level of median IRR is not worth the added risk an investor would need to take. We believe this approach to IRR optimally balances key participant, plan and market assumptions. It also allows us to assess the likelihood of a successful retirement for plan participants in light of their dual objectives: maintaining their lifestyle and not outliving their assets.
Asset allocation
Effective target date portfolio management goes beyond determining the optimal equity and bond mix over a participant’s life cycle. Determining which sub-asset classes to include in an equity and bond mix is equally important. Accordingly, sub-asset class breadth and how the sub-asset classes are adjusted to manage the various risks that a participant faces are also critical for a plan sponsor to understand and evaluate. Similar to glide path design, target date managers diverge significantly from one another when it comes to asset allocation. Breadth of exposure can vary by 10 or more asset classes; some managers invest in as few as 5 dedicated asset classes, while others access 15 or more.
Managing volatility with a robust list of asset classes
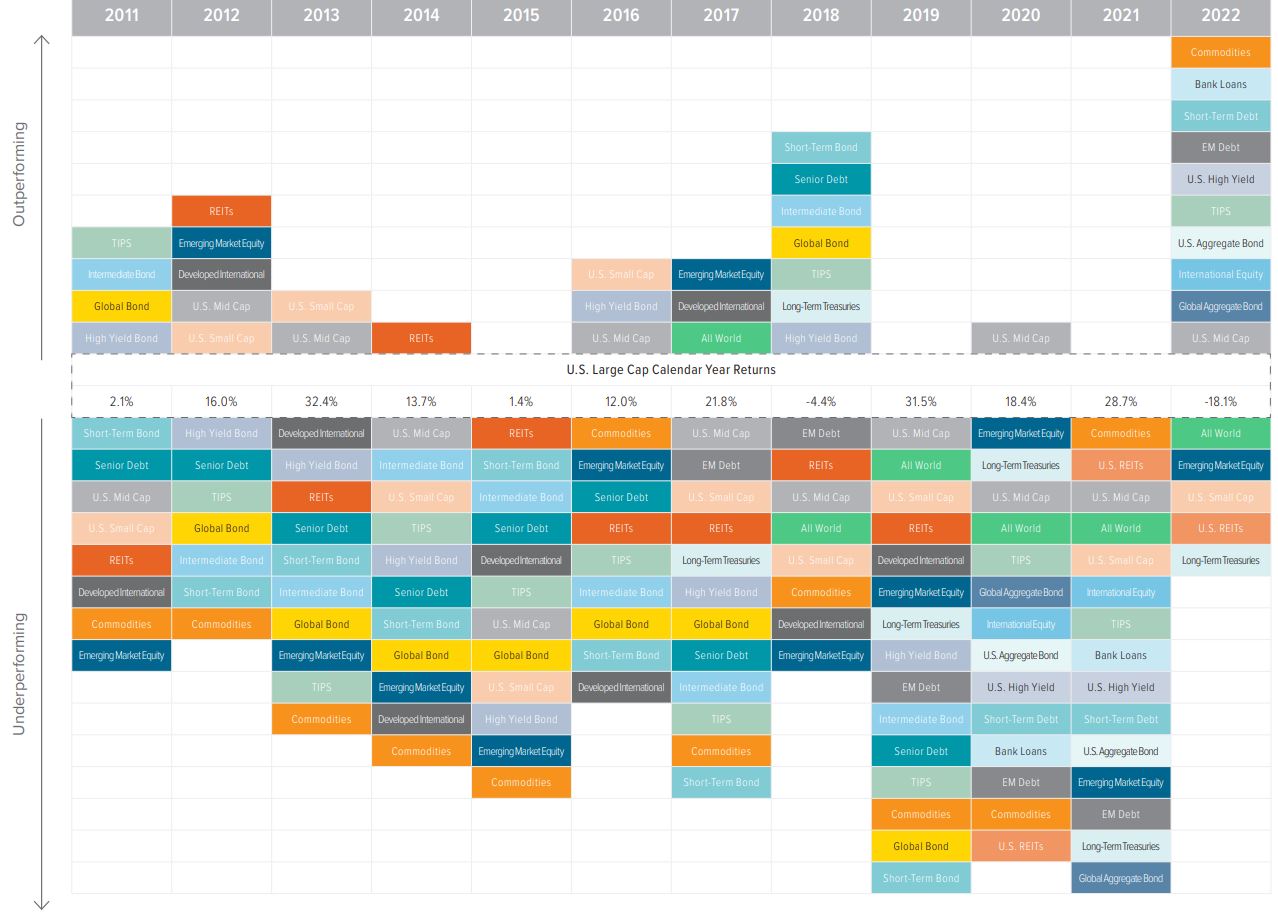
At Voya, we believe our investments across a broad range of risk premiums can potentially increase risk-adjusted returns over the long term and enhance our ability to manage varying risks. While the last ten years (2013–2022) generally were favorable for portfolios overweighting U.S. equities, we would note that academic evidence supports the long-term effectiveness of a globally diversified portfolio. The benefit of global diversification is highlighted in Exhibit 7 (previous page), which shows how various asset classes performed on a year-by-year basis since 2011 relative to U.S. large cap core, as measured by the S&P 500 index. Over the long term, asset classes perform differently in the various phases of market cycles. A properly diversified portfolio can dampen the effects of this asset class performance volatility, which is critical in the context of a target date fund built to accumulate and preserve assets over more than 40 years.
Exhibit 7. Long-term view: Ranking asset classes by annual performance reinforces the importance of diversification
Asset class correlations also help illustrate the benefits of broad diversification. Combining asset classes that have low correlation to each other minimizes the highs and lows of a portfolio’s return stream, compared with the return of each asset class on its own (Exhibit 8).
Exhibit 8. Correlation benefits of broad asset class exposure
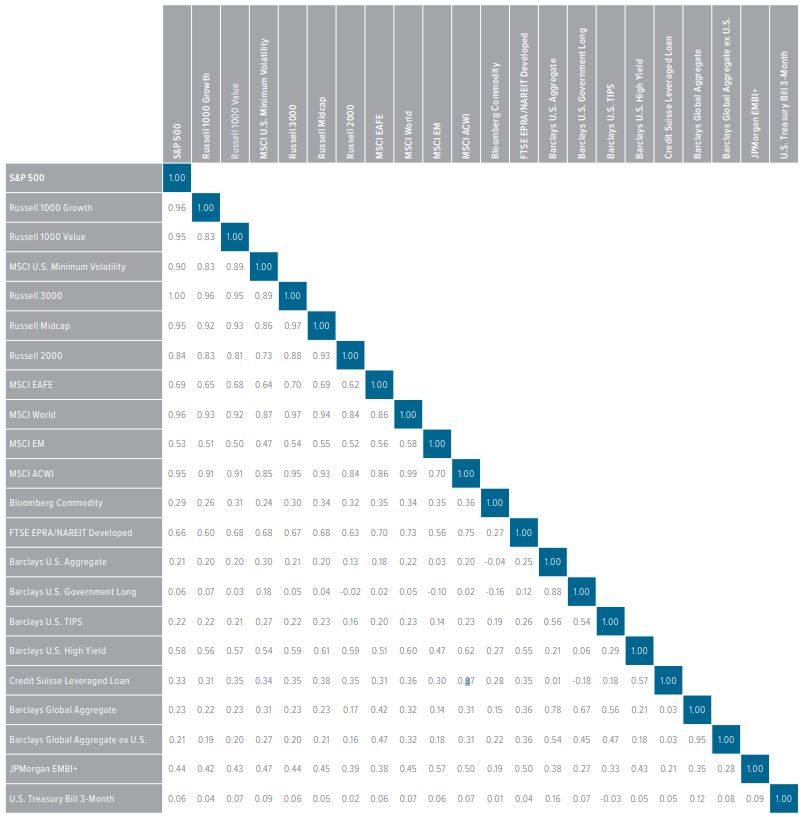
As of 12/31/2022. Source: Voya Investment Management. Projections are subject to change.
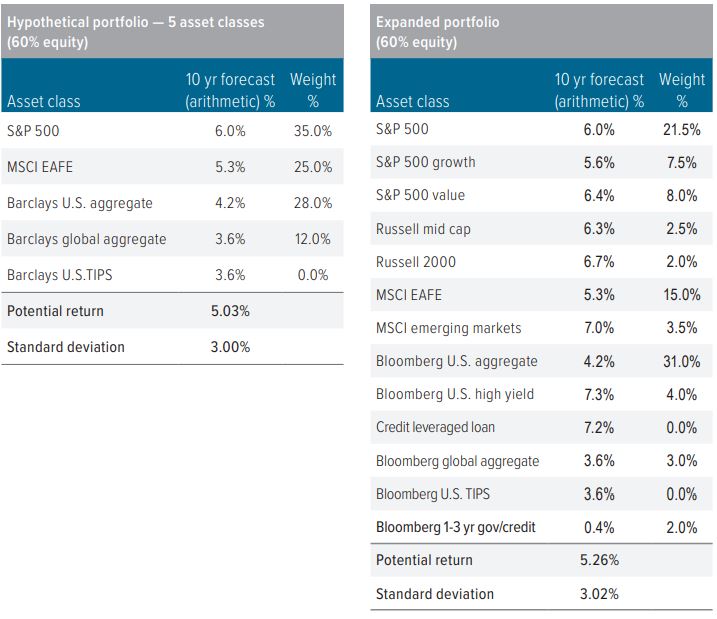
To illustrate the effect of asset class exposure, we compare two target date portfolios with the same equity and bond mix. One is a hypothetical 60/40 portfolio that only invests in four traditional asset classes (U.S. equities, international equities, core fixed income and global fixed income) and the other is a hypothetical 60/40 portfolio populated with asset classes represented in our 2025 Portfolio, which invests in a broader set of both traditional and non-traditional assets. As Figure 9 illustrates, a portfolio with more diversifying asset classes potentially enhances risk-adjusted returns over the long term.
Combining asset classes with low correlation to each other potentially minimizes the highs and lows of a portfolio’s return stream.
Exhibit 9. Asset class diversification has the potential to enhance risk-adjusted returns
Every asset class used in our strategic allocation is subject to rigorous analysis prior to inclusion. Each asset class is expected to be additive to risk-adjusted return or to otherwise increase the probability of reaching the portfolios’ objectives. In general, asset classes are only included within our target date portfolios when they provide a statistically significant increase in risk-adjusted return.
As participants move closer to retirement, Voya’s target date funds address the need to preserve wealth — not only in the glide path but also by shifting to less volatile asset classes.
In Exhibit 10, we provide a rationale for the inclusion of non-traditional asset classes used in the majority of our target date suites.
Exhibit 10. Voya’s disciplined approach to incorporating non-traditional asset classes
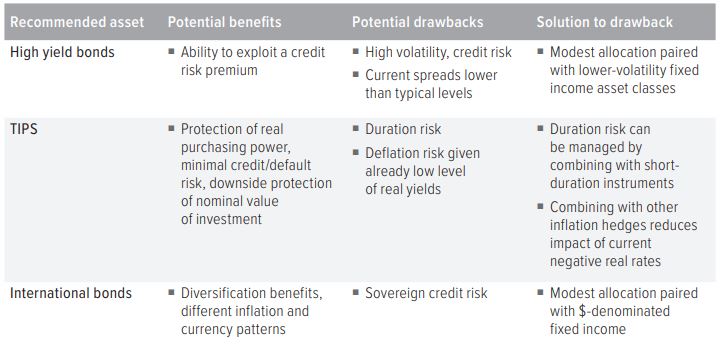
Source: Voya Investment Management
Flexible asset allocation to meet changing risks
Target date funds span an investor’s entire life cycle. Accordingly, they must adapt to the evolving risks participants face as they work, save and retire. Voya’s active approach to asset allocation manages sub-asset class exposures to mitigate these different risks as they rise and fall over time.
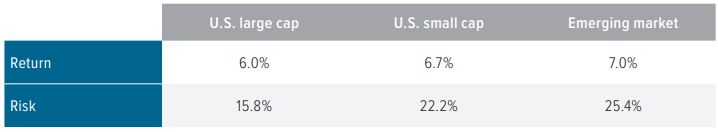
In our discussion about glide path design, we highlighted how participants are well positioned to both withstand and benefit from portfolio volatility early in their careers. Accordingly, our glide path delivers greater exposure to equities to help maximize returns in the accumulation phase of investing. Our flexible approach to asset allocation also allows us to deliver broader exposure across equity asset categories, as our target date funds provide access to U.S. small cap and emerging markets. Despite the possibility for short-term volatility, these investments also offer the potential for attractive returns, given a sufficiently long investment horizon (Exhibit 11).
Exhibit 11. Maximizing returns in the accumulation phase: Broader exposure to equity asset classes delivers potential outperformance
Ten-year risk and return forecasts
As participants move closer to retirement, Voya’s target date funds address the need to preserve wealth — not only in the glide path but also by shifting to less volatile asset classes such as U.S. large cap equities, and simultaneously emphasizing income-producing assets such as high yield bonds and other forms of corporate credit. Our near-dated portfolios also use asset classes that have a positive sensitivity to inflation to ease purchasing power erosion for participants close to retirement.
Given the long-term nature of retirement portfolios, we do not believe a static approach is appropriate. Voya’s dedicated asset allocation team and portfolio managers take risk-aware, tactical asset allocation positions throughout the year to reflect short- to intermediate-term market views. These tactical shifts allow participants to benefit from active risk management and potentially higher returns. However, our tactical shifts do not offset our longer-term strategic views, as they are limited to 100 basis points of tracking error relative to our strategic asset allocations.
Voya’s target date funds feature diverse managers and investment strategies.
Screening and selecting underlying investment managers
When it comes to underlying managers, plan fiduciaries should evaluate target date funds based on three key considerations:
- To what extent are the underlying managers diversified across investment philosophies and firms?
- What is the due diligence process for selecting and monitoring managers?
- Is there a dedicated team responsible for underlying manager research?
Voya’s open architecture approach
Few plan sponsors would ever consider constructing their core investment menu using just one investment manager. Plan sponsors recognize that an investment menu that offers a diversified roster of investment managers, including both active and passive styles, can help them better serve their participants and meet their fiduciary responsibility. Voya’s target date funds are constructed with that in mind. Unlike target date funds that are limited to using only proprietary products, Voya’s target date funds select from a universe of managers from across the industry, utilizing both active and passive strategies. We believe this approach offers the following advantages:
Access to top managers: We have the flexibility to add and replace managers over time, since many factors — style headwinds, firmwide issues, manager turnover, etc. — can impact a manager’s ability to outperform over long periods and in different market conditions.
Diversification across managers reduces single manager risk: The benefits of diversification extend well beyond asset classes, geographies and investing styles. We believe portfolios also benefit from diversification across investment managers.
No capacity constraints: We are able to add additional managers when an underlying fund grows large enough that executing transactions begins to influence available pricing. Closed architecture strategies are particularly vulnerable to such capacity issues, as they may have no other investment options when an underlying strategy grows too large.
Easy addition of new asset classes: Closed architecture target date strategies are unlikely to have strategies available in all asset classes, especially in more specialized areas. An open architecture approach allows us to invest in any asset class that we believe will enhance our risk-adjusted returns.
Required framework for successful implementation of open architecture
While implementation of open architecture has many benefits for investors, it can be a challenge to implement successfully. Finding managers that deliver consistent alpha requires in-depth analysis, establishment of objectives and a repeatable selection process. It’s also important to perform ongoing monitoring of selected managers and their portfolios. Additionally, thoughtful portfolio construction must be performed across multiple managers and strategies and then integrated into the asset allocation framework. Close coordination between asset allocation and manager selection is also critical.
While open architecture has many benefits for investors, implementation requires close coordination between asset allocation and manager selection.
Dedicated manager research and selection team
In order to successfully deliver on an open architecture solution, our target date team employs a dedicated manager research and selection team (MR&S) that is responsible for due diligence, selection and ongoing monitoring of the underlying managers within our target date portfolios. This team has over 10 years of experience working within an open architecture target date framework, and it consists of career research analysts who average nearly 20 years of industry experience. Voya’s manager research and selection team members are assigned specific asset class responsibilities and are supported by a team of quantitative analysts. The MR&S team also provides oversight to Voya’s entire mutual fund platform, which totaled over $85 billion as of March 31, 2023, as well as more than $5 billion in collective investment trusts and custom target date mandates. Overseeing this large pool of assets provides access to the industry’s most respected investment managers as well as leverage when negotiating fees.
The MR&S team operates independently to foster unbiased decision-making, which helps to ensure an optimal combination of diverse managers and investment styles. We believe this approach helps us achieve consistent results over time. To ensure independence in selecting between proprietary and non-proprietary funds, our analysts’ compensation is directly linked to the performance of the underlying managers they recommend.
Proprietary scoring methodology promotes consistency over time
Recognizing that our analysts will likely exhibit different inherent biases in how they evaluate the managers they follow, we utilize a comprehensive proprietary scoring methodology to evaluate underlying managers and ensure consistency. Analysts assign a numeric score to 59 factors assessed as part of our due diligence. The factors include both quantitative and qualitative metrics. We believe this disciplined approach helps ensure consistency in analysis over time and across analysts. Each firm and strategy conviction score that an analyst submits is reviewed and discussed with his or her peers and the head of MR&S. The factors include rolling-period analysis of risk and return characteristics relative to benchmark and peer group, as well as holdings-based multifactor performance and risk analysis. In addition, our analysts conduct quarterly review meetings and perform annual on-site due diligence visits with their managers. Exhibit 12 summarizes the key factor categories in our scoring methodology. These roll up to two main scores, an investment strategy score and a firm score: The scores are then used to evaluate managers over time as well as relative to each other.
Exhibit 12. Voya’s rigorous evaluation of underlying investment managers
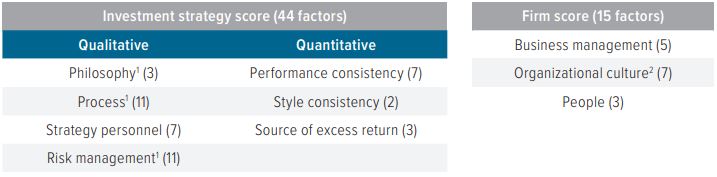
1 At the Strategy level, instead of a standalone ESG factor, ESG considerations are embedded within the Philosophy, Process and Risk Management categories.
2 At the Firm level, one of the factors within Organizational Culture is ESG Philosophy/ Integration, but ESG is also more broadly embedded in scoring of non-ESG factors.
Flexibility to replace underlying managers is critical
While the underlying strategies are intended to be long-term investments, we will replace a manager if we lose confidence in the firm or investment strategy, or if a higher-conviction manager may be available. Portfolio construction reasons, such as changes in asset allocation or changes in our outlook on the performance of active versus passive management, can also cause us to replace underlying managers. When we lose conviction in a strategy or investment firm, we will place that manager on our watch list.
The watch list process is formal and well documented so that discipline and consistency is maintained across analysts. Placing a manager on the watch list leads to heightened oversight and monitoring, but it does not automatically result in the removal of the manager.
When a strategy is placed on the watch list, the analyst conducts further due diligence on the manager. The manager is given nine months to demonstrate that significant progress has been made on remedying the watch list items; otherwise, a replacement search will be recommended. In certain situations, a one-time, three-month extension may be granted if the portfolio managers believe additional time is necessary. To ensure timely replacement of an existing manager, our analysts maintain an active bench of candidates across all asset classes. As with other aspects of our target date design, we do not believe a static approach is appropriate. Therefore, the flexibility to add or replace managers is an important part of our risk management and portfolio construction process.
Portfolio construction: Putting it all together
Effective portfolio construction is more nuanced than simply including the best-performing strategies in a target date manager’s available universe. To arrive at the optimal manager allocation for each asset class, as well as for the overall portfolio, it is critical for the manager to take into account all aspects of target date design, including the glide path, asset allocation and underlying managers, as well as to evaluate overall risk relative to portfolio objectives and constraints.
Separating manager selection from portfolio construction
Given the complex nature of target date portfolio construction, we believe that satisfying the constraints of the glide path, strategic asset allocation and manager (or index) choices simultaneously requires skill, experience and a unique toolkit. Therefore, we have a separate and distinct portfolio construction team, which has oversight over the portfolios and is responsible for the final manager allocations within the target date portfolios. This team utilizes a state-of-the-art portfolio construction process employing proprietary tools to optimize manager allocations. Our quantitative tools integrate views from the asset allocation team, investment manager inputs, and fund-specific considerations from the MR&S team to build portfolios tailored for specific objectives and constraints. Key considerations include:
- Manager and index alpha expectations
- Asset class return expectations
- Active vs. passive
- Upside/downside capture
- Factor risks
- Fee budgets
- Risk constraints
- Manager concentration
- Fundamental insights
- Scenario analysis
The advantage of blending active and passive styles
One of the critical decisions for our portfolio construction team is the active/passive approach within each asset class, as well as within each vintage. At Voya, we believe there is an advantage to utilizing a mix of active and passive managers within our target date suites. The decision to gain active or passive exposure depends on the asset class, the market environment, and a participant’s proximity to retirement.
When determining the active and passive mix for our target date funds for each asset class, we analyze:
- Alpha opportunity set within each asset class — Historically, how has active management performed relative to the passive alternative, after fees? Do certain market environments favor active versus passive in a particular asset class?
- Up/down capture management across the glide path — Do active or passive managers tend to provide better upside or downside capture ratios? If so, how can we take advantage of that within different target date vintages?
- Liquidity management — Does the active or passive vehicle offer enough liquidity?
- Fee constraints — What are the overall fee constraints of the target date suite?
- Availability and effectiveness of passive replication strategies — How effective is the passive vehicle at replicating benchmark returns (high or low tracking error), and at what cost?
- Credit exposure management — How effective are the fixed income managers at adjusting their credit exposure throughout the business cycle?
The active vs. Passive debate: What does the research show?
To assess the benefits of active versus passive approaches, we conducted an in-depth study of a wide range of asset classes, based on academic and industry research as well as 20 years of historical data.
One of the key findings of our research is that certain equity and alternative asset classes offer more alpha potential than others. Therefore, we typically allocate a higher portion to passive managers in asset classes where alpha potential historically has been low — such as U.S. large and mid cap equities. By contrast, we tend to favor active managers in small cap equities, international developed equities, emerging markets, real estate and commodities. Historically, these asset classes have provided more alpha opportunities for active managers, even when taking fees into account.
Fixed income managers tend to overweight credit
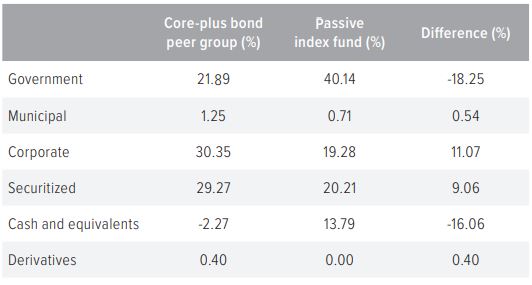
For core fixed income strategies, there is less debate when it comes to active versus passive: Over long periods of time, active fixed income managers have demonstrated an ability to outperform an index. In the search for alpha opportunities, however, active core fixed income managers tend to overweight credit relative to their index benchmarks. As of year-end 2022, the average manager within the Morningstar Intermediate-Term Bond Peer Group had about a 18% underweight to government securities and greater than a 20% overweight to corporate and securitized credit (Exhibit 13). As a result of this credit bias, many active core fixed income managers tend to outperform the index during an economic expansion but tend to underperform during an economic contraction — particularly in its initial stages, when managers are likely to hold onto credit too long. This observation has influenced our portfolios in two ways:
- We tend to favor active fixed income managers who have demonstrated the ability to successfully generate alpha during different stages of the business cycle.
- We tend to blend active and passive fixed income near and during retirement to better manage the portfolio’s credit exposure for those participants with shorter time horizons. For portfolios further away from retirement, we favor active fixed income managers who offer greater alpha opportunities over the long term.
Exhibit 13. Active fixed income managers tend to overweight credit
Morningstar intermediate-term core and core-plus bond peer group (%)
While the above analysis on active and passive is used to inform our manager allocation decisions, our portfolio construction process also directly takes into account our alpha expectations for the specific underlying active managers that our manager research and selection team recommends. Therefore, we may use an active manager in a highly efficient asset class, or in a historically challenging market environment for active managers, if our team has high conviction in that manager’s ability to consistently outperform peers and the benchmark over time. Finally, active/ passive is only one input into our portfolio construction process. The other critical components mentioned above (i.e., fee budget, risk constraints, manager concentration, fundamental insights) are all taken into account and will affect the overall manager allocations.
Conclusion
Evaluating target date funds is a multi-faceted process that involves a deep dive into the four key aspects of target date design — glide path, asset allocation, underlying managers and portfolio construction — to select one that is best aligned with a plan’s objectives, philosophy and participants. This also allows the plan fiduciary to evaluate fees relative to the value that the target date manager provides.
Voya’s disciplined approach to each of these four components is directly focused on helping investors prepare for a successful retirement.
We believe this holistic approach provides the following benefits to plan sponsors and ultimately participants:
- Glide path design that seeks to maximize risk-adjusted returns throughout the accumulation phase and to preserve accumulated assets in the preservation and withdrawal phases of the investor’s life cycle
- Asset allocation that is diversified across a broad range of risk premiums, to enhance risk-adjusted returns over the long term and augment our ability to manage varying risks based on the investor’s proximity to retirement
- Underlying manager construct that reflects retirement plan best practices by granting exposure to respected investment managers across the industry, providing an additional layer of diversification that may be beneficial to investors
- Portfolio construction that thoughtfully builds a target date suite, balancing all aspects of target date design with the changing risks that an investor faces through an entire life cycle