
Michael Coyne, CFA
Head of Small Cap Growth, Portfolio Manager

Scott Herrick
Client Portfolio Manager, Small Cap Growth
Core inflation remains high despite the Fed’s aggressive interest-rate hikes. Is now the time to allocate to US small cap stocks?
Highlights
- Inflation resistance: In the inflationary 1970s, US small caps outperformed large caps by 4% annually.
- Compelling value: US small caps are trading at a 45.6% price-to-earnings discount to large caps—well below the historical average.
- Active stock selection: Prudent active management should, in our view, help navigate times of economic slowdown.
US small caps can, in fact, deliver results in periods of high inflation
From World War II until now, the US has experienced roughly half a dozen episodes in which inflation (as measured by the Consumer Price Index) exceeded 5%. The 1970s isn’t the most recent occurrence of heightened inflation, but the decade does represent the longest stretch of it. For insight into that era, we turn to the work of well-known economist Ken French, which relies on data from the Center for Research in Security Prices (the Russell 2000 Index didn’t exist until 1984). From 1970 through the end of 1979 — when inflation surged from nearly 6% to almost 14% — US small cap stocks returned 9.0% per year, compared with 5.4% for US large caps (Exhibit 1). While this doesn’t necessarily show a correlation between high inflation and small cap outperformance, it does suggest that rising costs present different obstacles to large companies than to their smaller peers — and that some small companies should be better positioned to overcome price inflation.
Small cap companies (those with a market capitalization under $2 billion) tend to have lower margins and may get squeezed by inflated input costs. However, well-managed small companies may be able to pass along price increases to their customers while controlling their own costs and increasing their productivity. We believe that these companies should enjoy stronger earnings growth, since incremental improvements in operating margins will have a more pronounced effect relative to their larger, higher-margin counterparts.
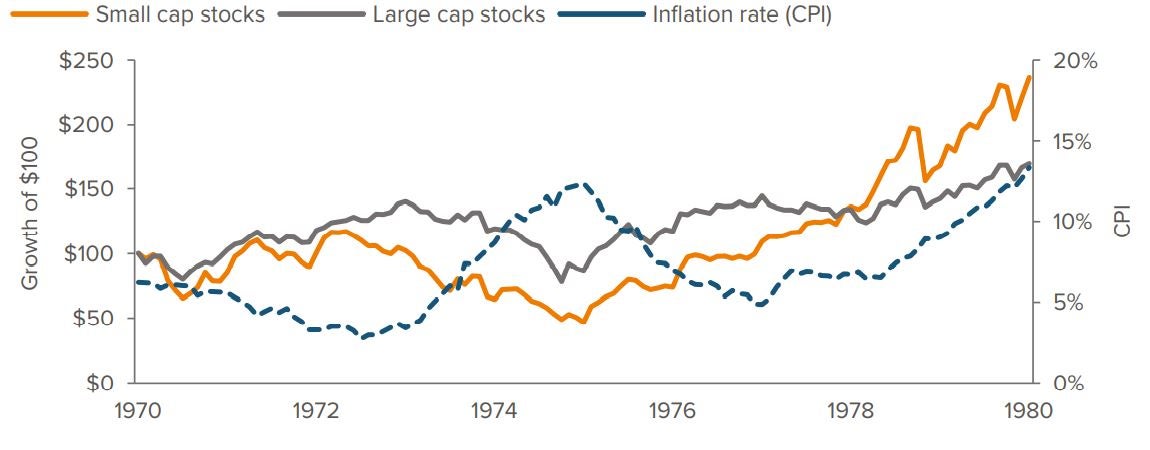
Source: Prof. Ken French (Dartmouth) and the Center for Research in Security Prices (CRSP) (large/small stock performance), US Bureau of Labor Statistics (CPI: Total All Items for the US), Voya Investment Management. Large and small cap returns begin in 1979. To measure the performance of these categories during the 1970s, the chart is based on the work of Nobel Economics laureate Ken French, which uses data from CRSP to create three portfolios: large cap (top 30% by market cap), mid cap (middle 40% by market cap) and small cap (bottom 30% by market cap). Monthly returns for each portfolio are calculated as the market cap-weighted average return. The results of large and small cap performance using this method are tightly correlated (>97%) with the respective Russell 1000 and Russell 2000 Indexes since index inception (01/01/84–03/31/23). Past performance is no guarantee of future results.
US small caps offer a compelling valuation case
Following sharp compression in earnings multiples year to date, US small cap growth stocks are at their cheapest levels relative to large cap growth stocks since January 2001. Over the long term, the Russell 2000 Growth Index (R2000G) has traded at a 4% average price-to-earnings (P/E) discount to the Russell 1000 Growth Index (R1000G). Today, the P/E ratios for the indexes are 15.02x and 27.64x, respectively, representing a 45.6% discount (Exhibit 2).
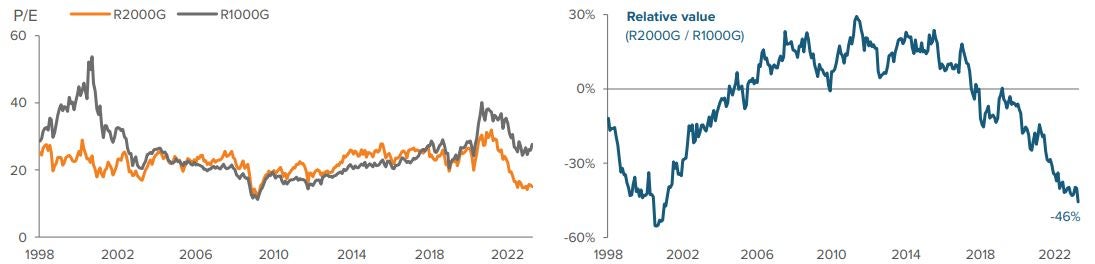
As of 03/31/23. Source: FTSE Russell, Voya Investment Management. P/E: Trailing 12-month price/earnings ratio, based on the Russell 2000 Growth Index (small cap) and Russell 1000 Growth Index (large cap). Past performance is no guarantee of future results.
Beyond the P/E story, US small caps are trading at discounts to their large cap counterparts across most valuation metrics, except for price to cash flow (Exhibit 3). Since valuation relationships tend to revert to their means, we see potential for significant relative upside for the small cap universe.
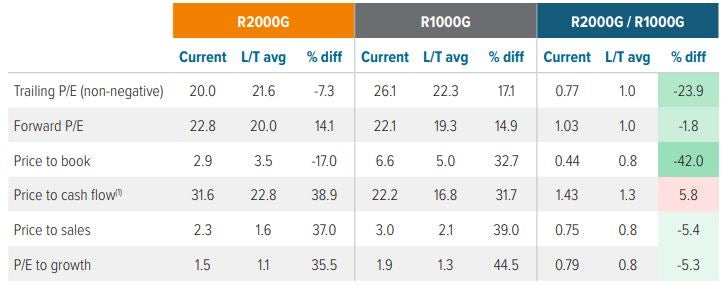
As of 03/31/23. Source: FactSet, FTSE Russell, Jefferies estimates from 03/31/16 onward. (1) Price to cash flow started in 2002.
Stock selection will be key amid slowing economy
Earnings growth is expected to decline for both small and large companies amid concerns about an economic slowdown and a possible recession this year. In our view, prudent stock selection will play a key role in navigating this environment, particularly within companies and industries that are expected to benefit from strong secular demand trends, such as IT software companies that offer security, accounting or efficiency-enhancing services. We believe that companies with a decisive competitive edge (due to proprietary technology or high barriers to entry), lower debt profiles, and strong cash flow should outperform their respective markets.
As investors continue to grapple with questions about inflation, geopolitical concerns and economic difficulties, we believe US small cap stocks offer attractive characteristics for those pursuing long-term investment goals.