Reimagining the 60/40 Portfolio with Private Equity Secondaries
Sunset over mountains

Secondary private equity can potentially enhance the return and risk profile of a traditional 60/40 portfolio.

The core investment portfolio needed to balance return and risk–long viewed by financial advisors as a prototypical 60/40 stock/bond allocation–is taking on a different look. We believe advisors are coming to the same conclusion as institutional investors: alternatives are not alternatives anymore. 

Accordingly, advisors appear to be making alternatives a core component of strategic asset allocations. As a result, some investors are seeking to add private markets to portfolios to potentially achieve greater longer-term returns and mitigate risk.

A long track record of higher returns and lower risk

Secondary private equity (PE) has emerged as an alternative way to access private markets. Investors may benefit from its potential for attractive returns, modest volatility and lower correlations to other asset classes. 

Over the long term, secondary private equity has delivered higher absolute and risk-adjusted returns compared to public equities (Exhibit 1).
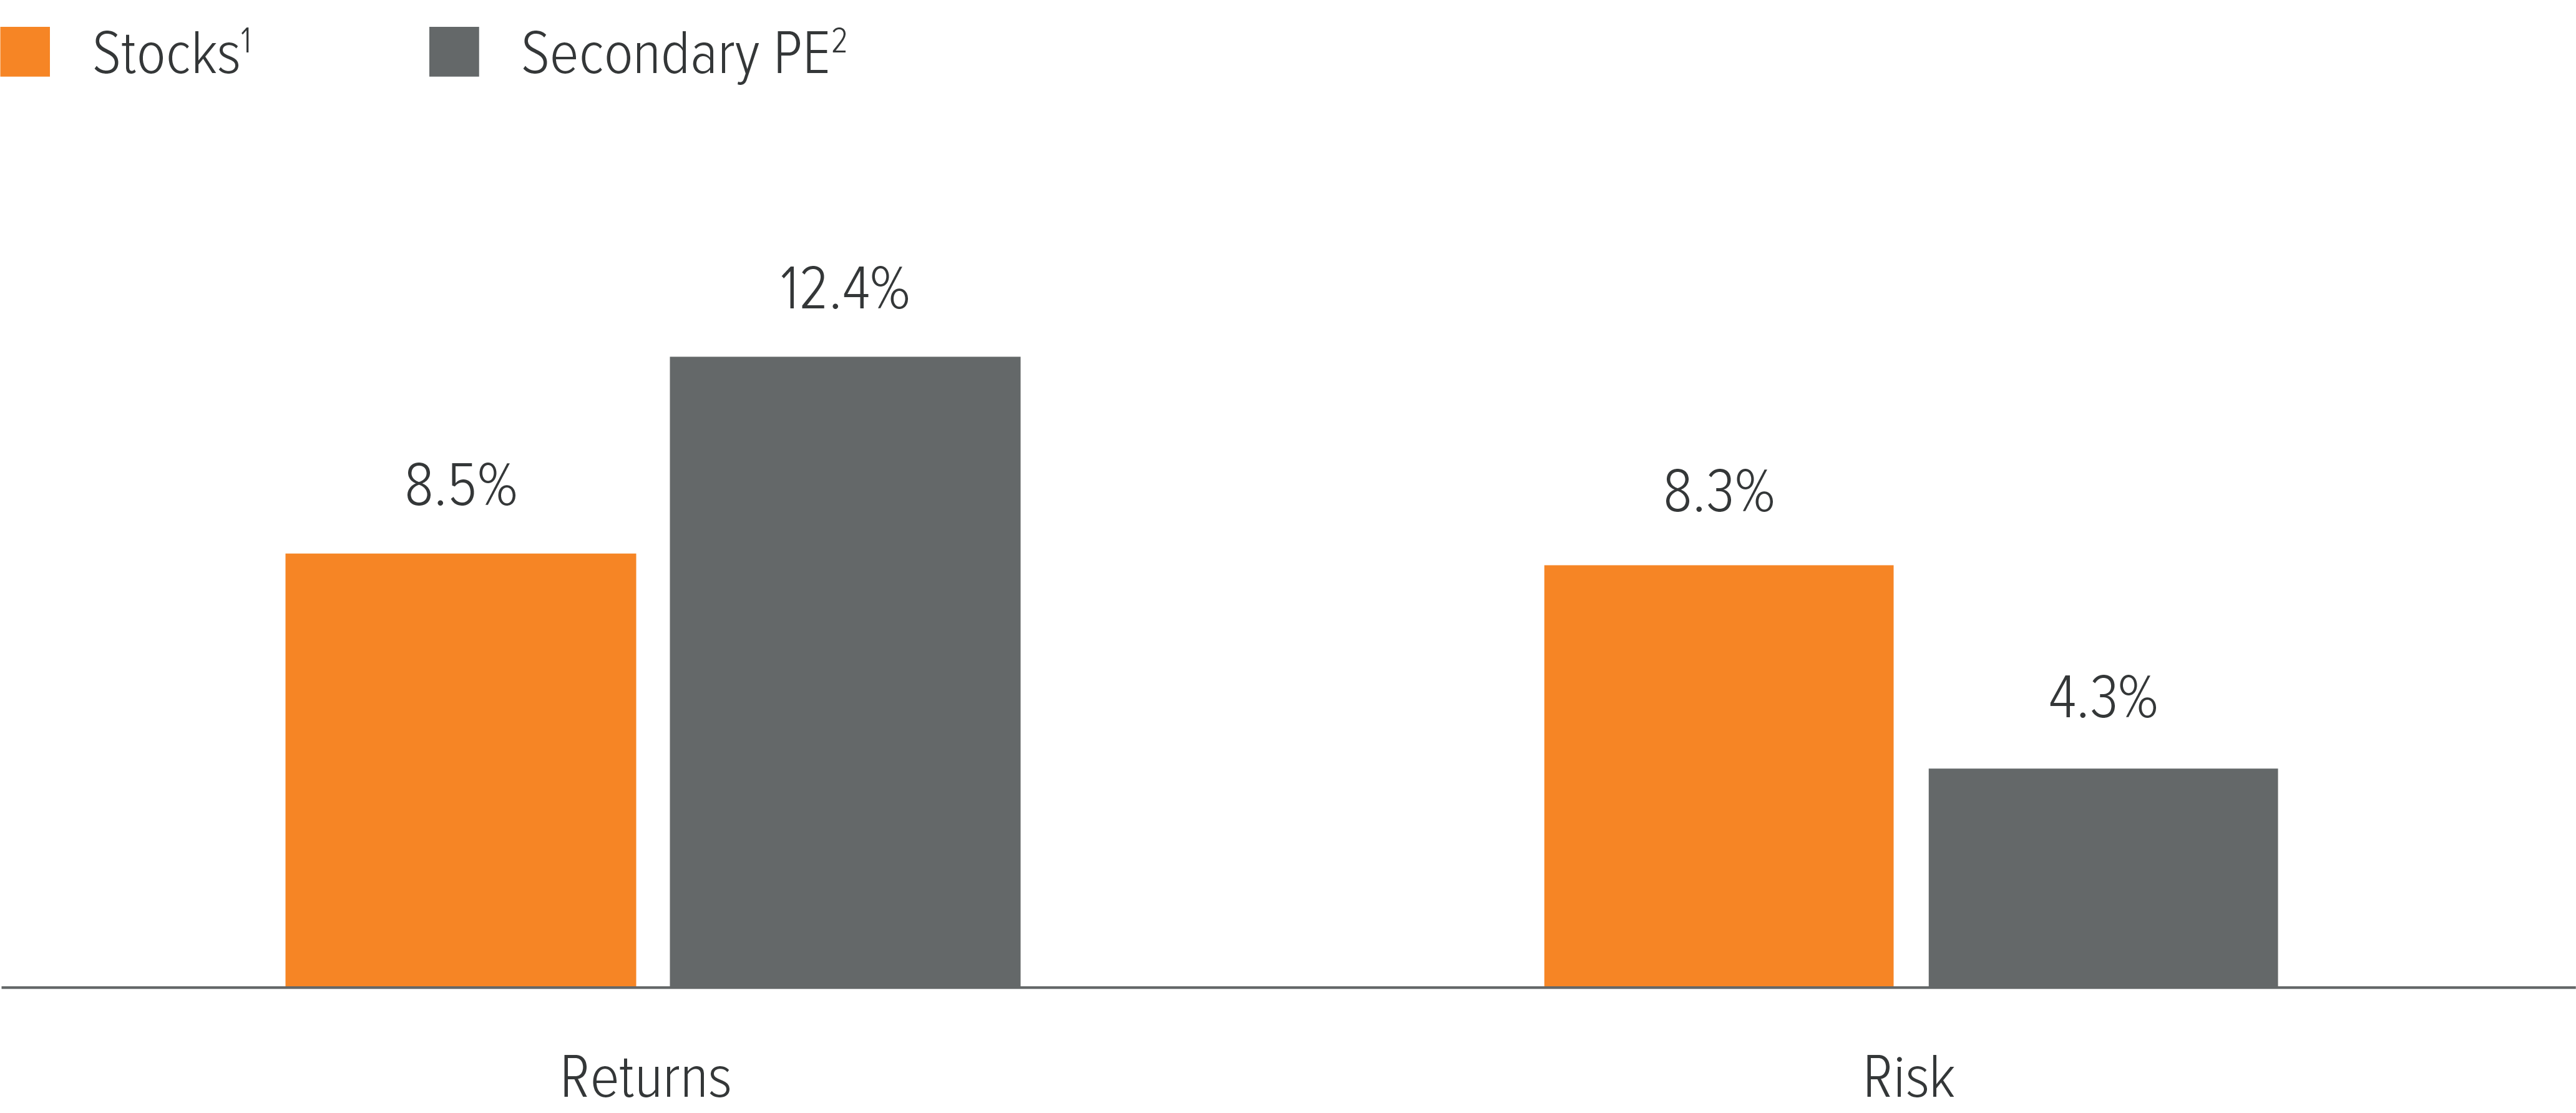
Exhibit 1: Secondary PE has outperformed public equities with less risk
Annualized returns and risk: 20 years ended 12/31/24
Exhibit 1: Secondary PE has outperformed public equities with less risk

As of 12/31/24. Source: MSCI, Bloomberg and Cambridge Associates. Past performance is no guarantee of future results. See disclosures for index definitions and other disclosures.

Historically strong downside protection

When broader market conditions deteriorate, secondary private equity investments have exhibited lower volatility and downside risk compared to public equity, and even primary private equity investments (Exhibit 2).

Exhibit 2: Secondary PE has delivered stronger historical downside protection
Cumulative returns during equity drawdown periods
Exhibit 2: Secondary PE has delivered stronger historical downside protection

As of 12/31/24. Source: Pomona Capital, Capital IQ (S&P), Cambridge Associates (CA Index). Data show cumulative quarterly returns during drawdown periods from 1999 to 2024. Past performance is not an indication of future performance. There is no guarantee that an investment in a Pomona-sponsored fund will ultimately be profitable. See disclosures for index definitions and other disclosures.

Secondary PE: A potential path to more attractive risk-adjusted returns

Adding secondary private equity to a 60/40 portfolio is a possible strategy to help enhance risk-adjusted returns. As the data below illustrates, reallocating a portion of the portfolio from public equities and bonds to secondary private equity enhanced the risk-return profile of the portfolio (Exhibit 3). 

By strategically incorporating secondary private equity into a traditional 60/40 allocation, advisors can seek to enhance risk-adjusted returns, diversify their holdings, and create a more balanced and resilient investment strategy for their clients’ portfolios.

Exhibit 3: Adding secondary PE to a 60/40 portfolio increased returns and lowered risk 

Annualized returns and standard deviation for 20 years


A note about risk 

General risks to consider 

Secondary investments: The ability of the manager to select and manage successful investment opportunities, underlying fund risks; these are non-controlling investments, no established market for secondaries, identify sufficient investment opportunities, and general economic conditions. 

Primary investment: Identify sufficient investment opportunities, blind pool, the manager’s ability to select and manage successful investment opportunities, the ability of a private equity fund to liquidate its investments, diversification, and general economic conditions. 

Venture Capital: Characterized by a higher risk and a small number of outsize successes, has the most volatile risk/reward profile of the private equity asset class. 

Growth Equity: These companies typically maintain positive cash flow and therefore present a more stable risk/reward profile. 

Mezzanine Financing: Has the most repayment risk if the borrower files for bankruptcy and in return, mezzanine debt generally pays a higher interest rate. 

Leveraged Buyout: Generally exited through an initial IPO, a sales to a strategic rival or another private equity fund, or through a debt-financing special dividend, called a dividend recapitalization. 

Distressed Buyout: Offer the opportunity to invest in debt securities that trade at discounted or distressed levels with the potential for higher future value if the company recovers. 

General private equity risks 

Private equity investments are subject to various risks. These risks are generally related to: (i) the ability of the manager to select and manage successful investment opportunities; (ii) the quality of the management of each company in which a private equity fund invests; (iii) the ability of a private equity fund to liquidate its investments; and (iv) general economic conditions. Private equity funds that focus on buyouts have generally been dependent on the availability of debt or equity financing to fund the acquisitions of their investments. Depending on market conditions, however, the availability of such financing may be reduced dramatically, limiting the ability of such private equity funds to obtain the required financing or reducing their expected rate of return. Securities or private equity funds, as well as the portfolio companies these funds invest in, tend to be more illiquid, and highly speculative.

IM4728052

Risks of investing and important disclosures

1 The MSCI World Index is a free float-adjusted market capitalization weighted index that is designed to measure the equity market performance of developed markets. The MSCI World Index consists of the following 23 developed market country indexes: Australia, Austria, Belgium, Canada, Denmark, Finland, France, Germany, Hong Kong, Ireland, Israel, Italy, Japan, Netherlands, New Zealand, Norway, Portugal, Singapore, Spain, Sweden, Switzerland, the United Kingdom, and the United States. (https://www.msci.com/world) while Pomona’ focuses on primarily purchasing secondary interests in private equity funds. The MSCI World Index has not been selected to represent an appropriate benchmark to compare an investor’s performance, but rather is shown as a comparison to that of a well-known and widely recognized index. The MSCI World Index is not subject to any of the fees and expenses to which any Pomona fund would be subject and no fund sponsored by Pomona Capital will attempt to replicate the performance of the MSCI World Index.

2 The Cambridge Secondary Funds Index is based on unaudited quarterly performance data compiled from 334 secondary funds (excluding hard assets funds), including fully liquidated partnerships, formed between 1991 and 2023. The index has limitations (some of which are typical to other widely used indices) and cannot be used to predict performance of the Fund. These limitations include: 1. Survivorship bias (the returns of the index may not be representative of all secondary funds in the universe because of the tendency of lower performing funds to not report returns to the index); 2. Lack of transparency (the specific funds that are included in this index are not disclosed by Cambridge Associates, and therefore cannot be independently verified); 3. Heterogeneity (not all secondary funds are alike or comparable to one another, and the index may not accurately reflect the performance of a described style); and 4. Limited data (many funds do not report to indices, and the index may omit funds, the inclusion of which might significantly affect the performance shown). 

The index does not represent the Fund’s performance, and has not been selected to represent an appropriate benchmark to compare an investor’s performance, but rather is provided to allow for comparison to that of certain well-known and widely recognized indices. Further, as Cambridge Associates recalculates the index each time a new fund is added, the historical performance of this index is not fixed, cannot be replicated, and differs over time from the data presented in this communication. See Cambridge Associates for a complete explanation on IRR calculations and assumptions. 

The investments within Pomona Investment Fund and the corresponding performance volatility thereof may differ significantly from the securities and or funds that comprise the Cambridge Index, which may contain strategies and asset types Pomona does not utilize. The Cambridge Index is not subject to any of the fees and expenses to which Pomona Investment Fund would be subject and no fund sponsored by Pomona Capital will attempt to replicate the performance of the Cambridge Index. Pomona does not pay any fees to Cambridge Associates to be ranked. 

3 The S&P 500 Index measures the value of stocks of the 500 largest corporations by market capitalization listed on the New York Stock Exchange or Nasdaq Composite. Standard & Poor’s intention is to have a price that provides a quick look at the stock market and economy. The composite performance of the S&P 500 is shown strictly for the purpose of comparison between the performance information contained herein and these popular public equity market indices. The S&P 500 is a widely recognized, unmanaged index of market activity based upon the aggregate performance of a selected portfolio of publicly traded common stocks. 

The performance of the S&P 500 shown in this document reflects the reinvestment of dividends and other distributions. In addition, the S&P 500 shown in this document is not subject to any of the fees and expenses to which any Pomona-sponsored fund would be subject. The S&P 500 has been selected as a general indicator of market health despite the lack of similarity of its underlying components to Pomona-sponsored funds. The S&P 500 index is not subject to any of the fees and expenses to which any Pomona fund would be subject to; Pomona-sponsored funds will invest in other market investment vehicles and will not attempt to replicate the performance of the S&P 500. http:// us.spindices.com/indices/equity/sp-500. 

4 Cambridge Associates LLC U.S. Private Equity: The index is a horizon calculation based on data compiled from 2,755 US private equity funds, including fully liquidated partnerships, formed between 1986 and 2023. The investments within a private equity fund and the corresponding performance volatility thereof may differ significantly from the securities that comprise the index, which may contain strategies and asset types a private equity fund does not utilize. The index is calculated on an annualized total return basis with dividends reinvested. The index has not been selected to represent an appropriate benchmark to compare an investor’s performance, but rather is shown as a comparison to that of a wellknown and widely recognized index. The index is not subject to any of the fees and expenses to which any private equity fund would be subject and no private equity fund will attempt to replicate the performance of the index. 

5 The Bloomberg US Aggregate Bond Index measures the performance of the US investment-grade fixed-rate taxable bond market, which includes the following types of securities and typically only includes securities that have $300 million or more of outstanding face value and at least one year remaining to maturity: investment-grade US Treasury bonds, government-related bonds, investment-grade corporate bonds, mortgage passthrough securities, commercial mortgage-backed securities and asset-backed securities that are publicly offered for sale in the U.S. The investments within a private equity fund and the corresponding performance volatility thereof may differ significantly from the securities that comprise the index, which may contain strategies and asset types a private equity fund does not utilize. The index is calculated on a total return basis. The index has not been selected to represent an appropriate benchmark to compare an investor’s performance, but rather is shown as a comparison to that of a well-known and widely recognized index. The index is not subject to any of the fees and expenses to which any private equity fund would be subject and no private equity fund will attempt to replicate the performance of the index.

Past performance does not guarantee future results.This market insight has been prepared by Voya Investment Management for informational purposes. Nothing contained herein should be construed as (i) an offer to sell or solicitation of an offer to buy any security or (ii) a recommendation as to the advisability of investing in, purchasing or selling any security. Any opinions expressed herein reflect our judgment and are subject to change. Certain of the statements contained herein are statements of future expectations and other forward-looking statements that are based on management’s current views and assumptions and involve known and unknown risks and uncertainties that could cause actual results, performance or events to differ materially from those expressed or implied in such statements. Actual results, performance or events may differ materially from those in such statements due to, without limitation, (1) general economic conditions, (2) performance of financial markets, (3) interest rate levels, (4) increasing levels of loan defaults, (5) changes in laws and regulations and (6) changes in the policies of governments and/or regulatory authorities.

Top