Behind the Metrics: Finding Value in the Cross-Section of Fundamentals and Macro

Behind the Metrics: Finding Value in the Cross-Section of Fundamentals and Macro

Time to read: Minutes

Macro sensitivities and sector biases of traditional value metrics may affect how well they work in different market and economic environments. We take a broad approach, combining fundamental analysis with macro awareness to deliver more consistent through-the-cycle results.

Highlights

  • Macro sensitivities in value metrics: Each metric uses a different lens on “value,” and performance can vary depending on where we are in the business cycle.
  • Accounting for sector bias in value metrics: Neutralizing the sector bias that exists among traditional metrics can reduce the volatility of results. 
  • Excess capital yield offers a broader view of value: Voya’s proprietary value metric has historically demonstrated strong success in evaluating stocks in a variety of market environments.

No silver bullet for value investors

Value investing, in its simplest form, is about finding stocks that are trading for less than their intrinsic or book value. Buy when cheap, sell when expensive, reap the reward. Macroeconomic considerations tend to play little, if any, role in that type of fundamental, bottom-up analysis. If only it were that simple.

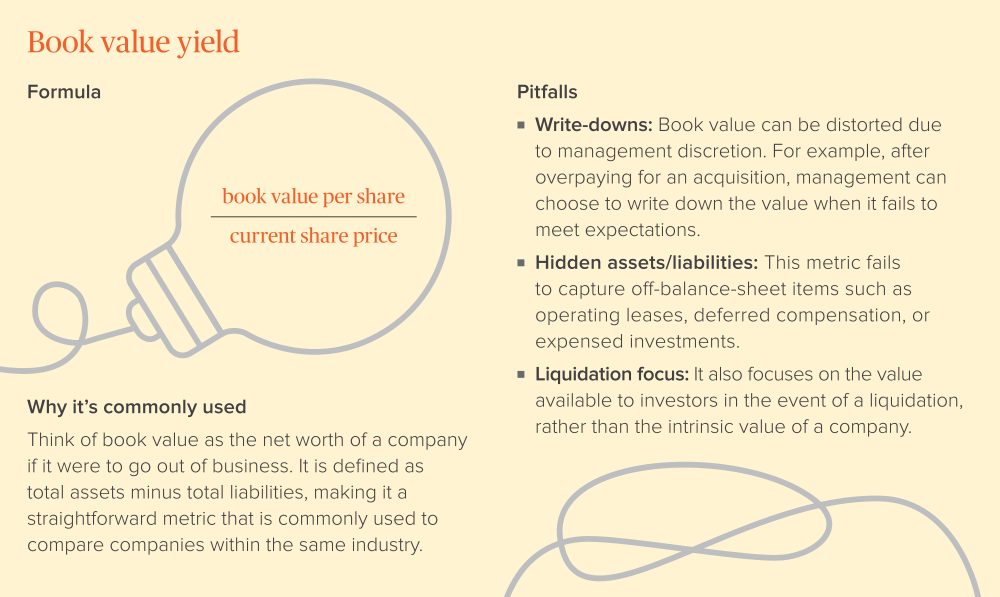
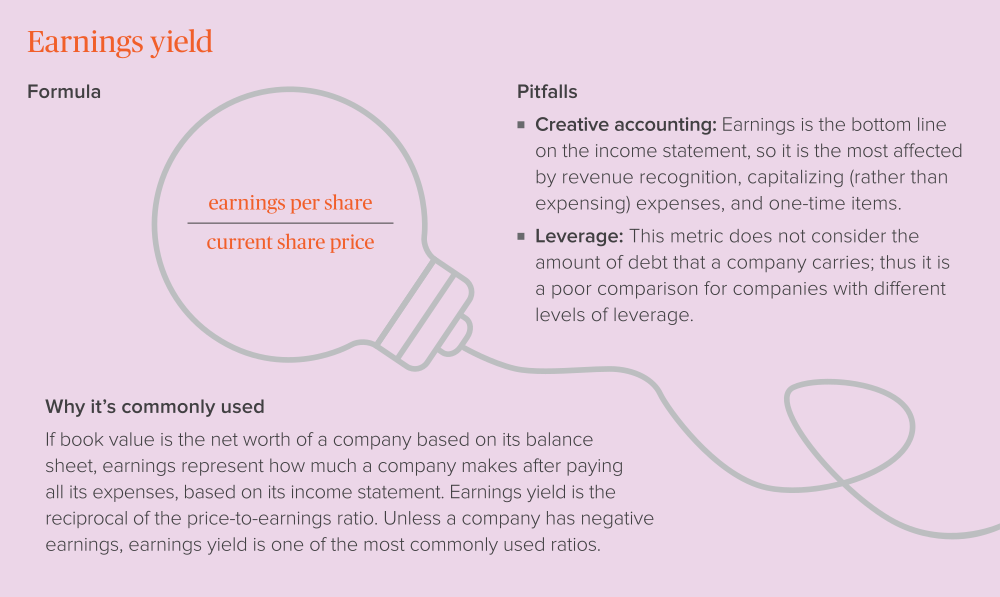
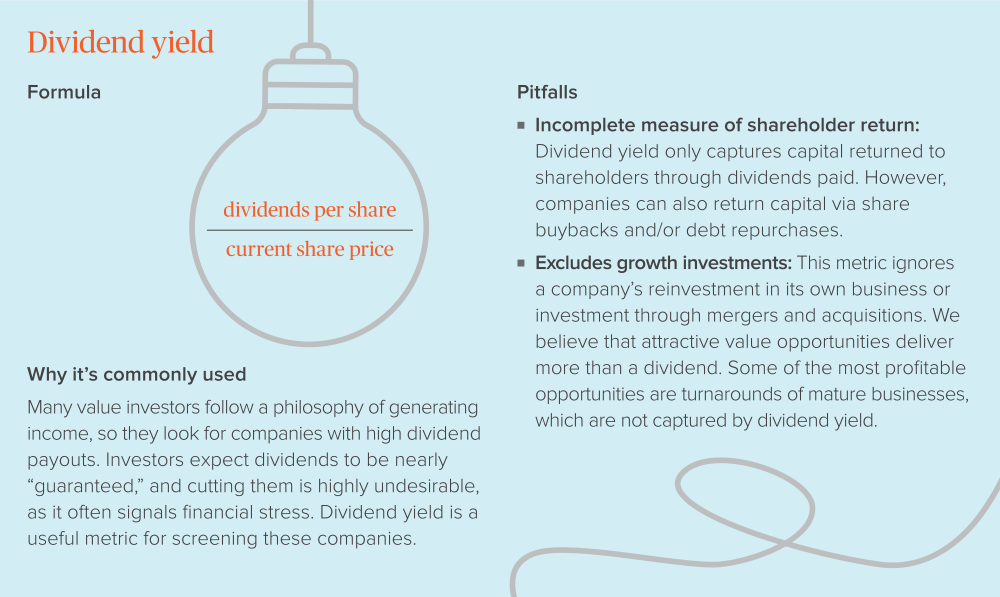
Value metrics tend to have varying degrees of utility depending on the state of the business cycle and the industry being analyzed, requiring an awareness of the macro environment. At Voya, our fundamental and quantitative equity research teams work together to get the broadest view possible, combining basic stock research with macroeconomic factor analysis. Although there are numerous value metrics in the toolbox, for the purpose of this analysis, we focus on a few widely used methods. We also include a complementary metric we call “growth assets,” which factors in the value of intangible assets such as intellectual capital, brand and organizational capital. Later, we’ll revisit the concept of excess capital yield and why we believe it’s an effective measure for navigating both stable and volatile environments.

1

1 A more comprehensive perspective of shareholder returns used by our portfolio management team is “total yield,” which includes the value of company share buybacks alongside the dividend payout.

2 Growth assets are defined as the combined value of the company’s intellectual property, human capital and brand (estimated from past spending on R&D, employee compensation and advertising.) The growth assets factor represents the estimated value of these intangibles relative to the total estimated tangible and intangible assets of the firm. For more detail on growth assets as a value metric, see De Boer, S. (2022) “Intangible Ironies: Investor Mispricing of Company Assets On and Off its Balance Sheet,” The Journal of Investing, 31(2) pp. 60–74; and Eisfeldt, Andrea L. et al (2022) “Intangible Value,” Critical Finance Review, 11(2) pp. 299–332.

Macro sensitivities in value metrics

Volatility in early 2023 offered a good test case of the varied behaviors of different value measures. Overall, value stocks widely underperformed in the first quarter, with the Russell 1000 Value Index climbing a meager 1%, compared with a 21% gain in the tech-heavy Nasdaq 100. Within the broader equity universe, the three traditional value metrics in focus all underperformed, with defensive high-dividend yielders lagging the most as the market climbed the proverbial “wall of worry.”3

A similar pattern is observable over the long term in factor analysis going back to 1953. Our analysis indicates that book to price tends to be somewhat cyclical, with a historical market beta of 1.01, whereas the dividend yield metric has a beta of just 0.67.4

Taking this further, Exhibit 1 plots the rate sensitivity of our three traditional value metrics versus historical inflation. The left panel shows that cyclical value — captured by stocks with a high book-to-price ratio — generally outperforms during periods of rising interest rates, regardless of the inflation environment. The more secular earnings yield value metric is less rate sensitive. (The growth assets metric was excluded from this analysis due to its comparatively shorter data history and applicability.)

Dividend yield, on average, has had negative exposure to interest rate changes, much like bonds. However, this sensitivity tends to lessen in periods of elevated inflation, as shown in Exhibit 2. The recent strong performance of dividend yield in the face of rising interest rates (at a time of elevated inflation) is in line with this historical precedent. One explanation is that during such regimes, the “substitution effect” of rate increases is dominated by high-yielders trading in line with value equities, which tend to then outperform growth stocks.

We see two paths forward for the economy in the near term, driving two approaches to risk management:

1
Exhibit 1: Interest rate and inflation dynamics
Average interest rate sensitivity of value strategies by inflation regime, Apr 1953 – Mar 2023
1
Exhibit 2: Higher inflation dampens rate sensitivity
Rate sensitivity of dividend yield factor vs. inflation rate, Apr 1953 – Mar 2023
1

Source: Fama–French performance data, Federal Reserve interest rate and inflation data, Voya IM analysis. Value portfolios are equal-weighted top 20% of U.S. all-cap stocks for the selected value metric relative to the return of the equal-weighted market. Inflation measured as 12M change in U.S. CPI. Rate sensitivity estimated through 36M trailing regression of portfolio returns on MoM change in 10Y Treasury rate.

Key points

a. Not all value metrics are created equal

b. Economic cycles affect value factor performance

Accounting for sector bias in value metrics

Sector-specific considerations can also have a major influence on value metrics. Book to price was built for the industrial age. It has worked well for energy stocks, where the book value of reserves is a key consideration in the companies’ valuations. It has also shown some relevance for industrials, where long-term assets such as manufacturing plants and equipment may put a floor on the share price. Dividend yield, on the other hand, lends itself well to more defensive industries such as financials and utilities.

When it comes to sectors driven more by innovation, such as information technology or communication services, cheap valuations based on the book value of assets may indicate trouble ahead for a stock. Companies in these sectors may have sizeable intangible assets, making the alternative “growth assets” metric a more suitable measuring stick.

Exhibit 3 charts the performance of our four focus metrics on a market-wide (unadjusted) basis and a sector-neutral measure. Over the past five years, unadjusted performance resulted in underperformance for two of the four metrics, with cyclical and secular value styles (book to price and earnings to price) lagging defensive dividend yield. Neutralizing sector biases mitigated this underperformance. Conversely, adjusting the sector bias in growth assets valuations reduced the metric’s level of outperformance, though it remained the strongest. In short, a fundamental understanding of which valuation metrics are most applicable to which types of stocks, together with prudent portfolio construction, may stand value investors in good stead.

Exhibit 3: Neutralizing sector bias in value metrics reduces variation among results
Top- vs. bottom-quintile 5-year performance: overall index (unadjusted) and equal weighted by sector (sector-neutral)
1

As of 03/31/23. Source: FactSet, Voya IM. 5Y trailing value factor and intangible growth assets performance equally weighted; Russell 1000 Index universe.

Excess capital yield offers a broader view of value

The distortions of sector and macroeconomic biases inherent in some traditional value metrics suggests the need for a more encompassing view of value. This is the intent of Voya’s proprietary concept of excess capital yield (ECY), which anchors our value investing philosophy. A critical differentiating feature of the ECY framework is its historical success in identifying attractive opportunities through market cycles.

chart

ECY provides a deeper, more forward looking view of the capital companies have for generating value in a variety of forms, including dividend growth, share repurchases, accretive mergers and acquisitions (M&A) and organic investment, with a performance track record to back it up (Exhibit 4).

Our fundamental equity team utilizes our quantitative equity research group’s macro sensitivity factor analysis. The team seeks out stocks with high excess capital yield, using their discretion to overlay the metrics and tilt positioning depending on the market environment. Thus, for value investors concerned that the macro tide has turned against more cyclical forms of value, there is no need to completely change their investment philosophy.

Prudent sector risk management and an openness to different forms of valuation — across macro regimes and fundamentally different segments of the equity market — offer a way forward that is less sensitive to the economic backdrop. Particularly given the elevated uncertainty regarding the near-term macroeconomic direction, we are confident value investors are well served by a more holistic approach such as the ECY metric.

Exhibit 4: ECY has historically outperformed other value factors
Cumulative, cap-weighted quintile spread returns, R1000V ex-REITs and utilities
Exhibit 4: ECY has historically outperformed other value factors

As of 12/31/22. Source: FactSet, analysis by Voya Investment Management. Past performance is no guarantee of future results.

Conclusion

  • Traditional value metrics have limitations, including sector biases and varying sensitivity to macroeconomic conditions. As a result, the relevancy of a given traditional metric will depend on the type of index or securities being evaluated, along with the macro environment.
  • Neutralizing sector bias is a prudent investment management technique that can reduce volatility among value metric results.
  • We believe in a broader approach to value assessment, including the use of non-traditional approaches — such as the inclusion of intangible assets and Voya’s proprietary excess capital yield metric. ECY, which anchors Voya’s large cap value investment philosophy, was designed to provide consistent results regardless of market environment.
Defensive equity investing for retirees

Some investors require an investment solution tailored to a specific objective, beyond reducing the macroeconomic sensitivity of a holistic value strategy. In the decumulation phase of retirement planning, investors often rely on investment income to sustain their lifestyle, while growing their assets in a way that does not neglect the need for capital preservation. Voya’s High Dividend Low Volatility Strategy offers access to equities with defensive characteristics and income potential, designed to meet the needs of risk-averse, income-focused investors.

2952749

3 FactSet data (1Q23); Voya IM factor analysis of the Russell 1000 Index.

4 Fama–French data (04/1953–03/2023); Voya IM beta analysis of equal-weighted top 20% of U.S. all-cap stocks for the selected value metric relative to the return of the equal-weighted market.


An investor cannot invest directly in an index, and index performance does not reflect the deduction of any fees, expenses or taxes. Index comparisons have limitations, as volatility and other characteristics may differ from a particular investment.

Russell 1000 Index measures the performance of the large-cap segment of the U.S. equity market and includes approximately 1,000 of the largest securities based on market capitalization, representing approximately 93% of the U.S. market. Russell 1000 Value Index measures the performance of companies in the Russell 1000 Index with lower price-to-book ratios and lower forecasted growth values. Nasdaq 100 represents 100+ of the largest U.S. and non-U.S. non-financial companies listed on the Nasdaq Stock Market based on market capitalization.

The principal risks are generally those attributable to investing in stocks and related derivative instruments. Holdings are subject to market, issuer and other risks, and their values may fluctuate. Market risk is the risk that securities or other instruments may decline in value due to factors affecting the securities markets or particular industries. Issuer risk is the risk that the value of a security or instrument may decline for reasons specific to the issuer, such as changes in its financial condition.

This information is proprietary and cannot be reproduced or distributed. Certain information may be received from sources Voya Investment Management (“Voya IM”) considers reliable; Voya IM does not represent that such information is accurate or complete. Certain statements contained herein may constitute “projections,” “forecasts” and other “forward-looking statements” which do not reflect actual results and are based primarily upon applying retroactively a hypothetical set of assumptions to certain historical financial data. Actual results, performance or events may differ materially from those in such statements. Any opinions, projections, forecasts and forward-looking statements presented herein are valid only as of the date of this document and are subject to change. Voya IM assumes no obligation to update any forward-looking information.

Voya Investment Management has prepared this commentary for informational purposes. Nothing contained herein should be construed as (i) an offer to sell or solicitation of an offer to buy any security or (ii) a recommendation as to the advisability of investing in, purchasing or selling any security. Any opinions expressed herein reflect our judgment and are subject to change. Certain of the statements contained herein are statements of future expectations and other forward-looking statements that are based on management’s current views and assumptions, and involve known and unknown risks and uncertainties that could cause actual results, performance or events to differ materially from those expressed or implied in such statements. Actual results, performance or events may differ materially from those in such statements due to, without limitation, (1) general economic conditions, (2) performance of financial markets, (3) interest-rate levels, (4) increasing levels of loan defaults, (5) changes in laws and regulations, and (6) changes in the policies of governments and/or regulatory authorities. Past performance is no guarantee of future results.

Top