Dave Goodson
Head of Securitized

Colin Dugas, CFA
Portfolio Manager, Securitized

Brett Cornwell, CFA
Co-Head of Client Portfolio Management, Fixed Income
The forecast for securitized credit has turned notably brighter in recent months, even as the dark cloud of offices continues to cast a long shadow. Will the summer sun break through or are we in for a tropical storm? Here are five markers to follow, with guidance on how we’re approaching the diverse securitized opportunity set.
1. Amid a crisis in CMBS, the healing process begins with a pickup in commercial property transactions, driven by lower rates and less rate volatility.
2. Prime consumer-oriented ABS such as private student loans and solar are early in their credit cycle — but watch for strains in subprime auto loans, which are at the epicenter of the growing stress facing lower-income consumers.
3. A new leg higher for housing is emerging, setting up a potential win/win scenario for residential mortgage credit — almost irrespective of the economic outlook.
4. CLOs are facing a historic situation: By the end of 2023, nearly half of current deals will exit their reinvestment periods at a time when typical extension options are almost nonexistent. With no refis and no resets available, can certain CLOs repay themselves?
5. Despite challenges in commercial real estate, we see green shoots of optimism for securitized allocations, with yield spreads unlikely to widen significantly further in a recession scenario that may never even arrive.
If this were a normal market, there would be a lot to like about securitized credit. Compare it to other risk markets such as bank loans, high yield or emerging market debt, and securitized credit features similar yields from higher-rated assets, with less duration risk, less cyclical exposure and low correlations to other fixed income categories. A wave of regulations has added numerous investor protections seeking to avoid another 2008-like calamity. And although a slowing economy will lead to higher defaults, securitized spreads seem unlikely to move much wider, certainly relative to other risk markets.
But this isn’t a normal market. Offices are suffering an existential crisis that has rattled the entire commercial mortgage-backed securities (CMBS) market and scared investors away from anything with a whiff of commercial property exposure. The cost of credit is at its highest in a generation. And the inverted Treasury curve presents a foreboding signal. It doesn’t help that memories of the pain in securitized markets in past recessions can be hard to shake. Educating investors that today’s situation is fundamentally different has been…well, let’s just call it an uphill climb. We love a good challenge.
Against this swirling backdrop, a more optimistic tone has taken hold within securitized credit thanks to a mix of falling rate volatility, easing inflation, resilient economic growth and improving liquidity. Although uncertainties remain, we believe a major opportunity is brewing.
Here are five factors that could shape how and when that opportunity unfolds.
1. A pickup in office transactions
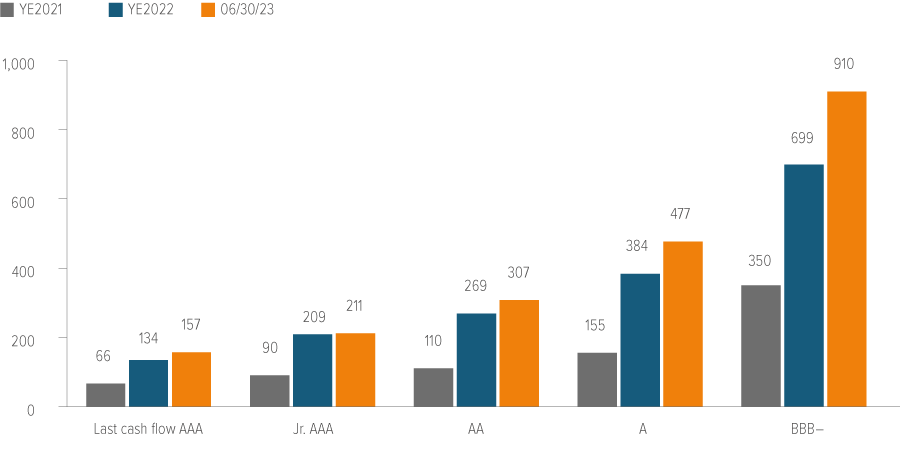
The CMBS market is in crisis mode. Issuance year to date is down 75% from the same period a year ago, spreads have continued to widen after gapping higher in 2022 (Exhibit 1), and property transactions have gone from record highs in 2022 to near decade lows in 2023 (Exhibit 2). Relative to other securitized sectors, CMBS prices are in the bottom 97th percentile of historical observations — and that includes the financial crisis.
These dire numbers are hard to reconcile with the health of most property types:
- High-tech industrial warehouses providing e-commerce delivery solutions are popping up at a record pace, and new tenants are filling them just as fast.
- Non-enclosed retail has shaken off its dead weight and is finding a way to coexist with digital storefronts, becoming one of the more attractive targets for investor capital today.
- Multifamily is coming off a caffeine high from the post-Covid runup, but the long-run trend remains positive given the lack of affordable housing and a wave of Gen Z and Millennial demographics forming new households.
As of 06/30/23. Source: J.P. Morgan.
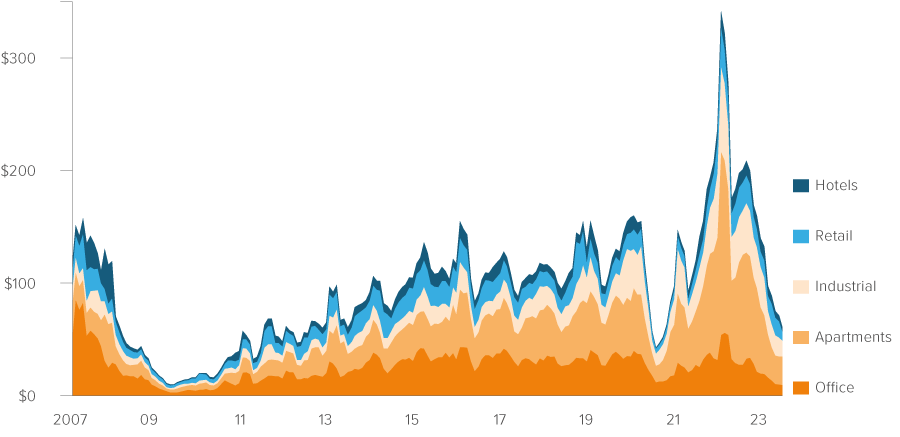
As of 05/31/23. Source: Real Capital Analytics.
Sources: Securitized credit investment characteristics: Voya IM, Morningstar Direct; 06/30/23. CMBS issuance: Voya IM, BofA Global Research; 07/14/23. CMBS relative value: Voya IM; 05/31/23.
The issue isn’t so much a real estate problem as it is an office problem. While the world moved on from Covid, hybrid work policies that balance in-office time with remote flexibility remain popular. According to keycard swipe data, office buildings nationwide are only half full on any given day. You still owe a full month’s rent even if your employees show up only two or three days a week, but you’ll be a lot less enthusiastic about signing a pricey new contract when your lease expires — especially if you’re in an older building or one that lacks more modern-day amenities. These dynamics have led to shrinking office space footprints and to occupancy rates that remain well below pre-2020 levels, even at discounted market rents.
This won’t be a quick fix, but it will resolve itself one way or another. Either workplace dynamics will shift to pull employees back into the office in more meaningful numbers, or older, less popular stock will be taken out of the market, eventually restoring utilization rates to sustainable levels above 80%. It’s worth noting that office vacancies are concentrated in a small proportion of overall stock, creating winners and losers that experienced managers may exploit.
30% of office buildings account for 90% of vacancies.
Source: JLL Research; 06/21/23. U.S. office vacancy by share of inventory.
In the meantime, the murky outlook for offices and significant uncertainty in cap rates have created a huge gap between prospective buyers and sellers across property types. Buyers are holding out for more clarity and better deals, while existing owners have little incentive to write down assets when they are still earning decent income and servicing loans at low rates. Until the bid/ask spread shrinks, markets can’t function efficiently.
How do we start the healing process? It begins with lower interest rates and less rate volatility. Tighter financing conditions may also spur some distressed selling, as any looming loan maturity in the near term will be vulnerable to default if borrowers are unable to refinance or negotiate a loan extension. A couple of quarters of increased transaction activity should give traders and lenders more confidence in valuations, helping to narrow the bid/offer spread. By early 2024, transaction markets should begin to thaw, clearing the way for a recovery in commercial real estate.
What we’re doing in CMBS:
Strategy
- Focus on the collateral, assessing property values using real-time market inputs to update loss expectations through the prisms of our CMBS and commercial mortgage loan teams. Take advantage of pessimistically priced outcomes for well-located non-office property types with strong sponsorship and low refinancing risk.
- Overlaying structural protections, pinpoint where it makes sense to take risk in the transaction’s capital structure. Credit enhancement and payment priority can offer protection against collateral losses — but only to a threshold where bondholders are exposed. With the market fearful, the benefit of these protections may be ignored or discounted, offering opportunity.
Positioning
- Favor newly issued, low-office conduit deals (BBB+ to AAA).
- Floating-rate non-trophy office single-asset/single-borrower (SASB) deals.
- Seasoned multifamily CRE CLOs and >BBB+ rated conduit holdings that have benefited from transaction deleveraging.
- Avoid lower-rated conduit deals (BBB– or lower), as well as enclosed mall, office (particularly those facing near-term loan maturities) and recently originated transitional multifamily credits.
- Seasoned, non-transitional multifamily credit risk via risk-sharing classes issued by the GSEs.
2. Emerging stress in subprime auto loans
Despite a potential recession in the distance, most households seem to be in a good mood about their finances. The Conference Board’s consumer confidence survey jumped in June to its highest level since the start of 2022, supported by optimism about jobs and wages. Consumer-oriented asset-backed securities (ABS) have been one of the cleanest opportunities to earn attractive risk-adjusted returns in securitized markets, with elevated spreads and a less rate-sensitive liability structure.
The situation is more troublesome for lower-income consumers, where rising costs for essentials such as groceries, rent and insurance have strained household budgets, forcing hard choices about which bills to pay. Subordinate parts of subsectors collateralized by these consumers look vulnerable, as evidenced by the rise in late payments (Exhibit 4). Subprime auto ABS appear especially at risk given elevated used car prices, delinquencies near current-cycle highs, and an inverted yield curve. So far this year, two subprime-focused private equity–backed dealer/lenders have already failed.
A softer economy could accelerate the higher delinquency trend, depress used car prices and generate more realized losses. However, non-prime borrowers represent only about 20% of the consumer base. The other 80% of the consumer market — coasting from fiscal largesse in the Covid years, combined with rebounding net worth — continues to offer an attractive backdrop for ABS opportunities.
What we’re doing in ABS
Strategy
- “Prime consumer” ABS look earlier in their credit cycle, with considerably more runway in terms of borrowing capacity and credit access.
- Discount-priced bonds, though limited to longer-duration subsectors, are attractive when available.
- Commercial-oriented flavors of risk tend to be more prone to economic cyclicality and may face more pressure in a recession.
Positioning
- Prefer non-benchmark subordinates from consumer-oriented subsectors (private student loans, solar, prime marketplace loans).
- Avoid deep subprime consumer (especially auto), subprime marketplace loans and buy now/pay later (BNPL) collateral.
- Generally avoid rail, aircraft and container ABS.
- An exception within commercial is whole business loans, predominantly restaurants with a proven business model, durable brand and tasty offerings.
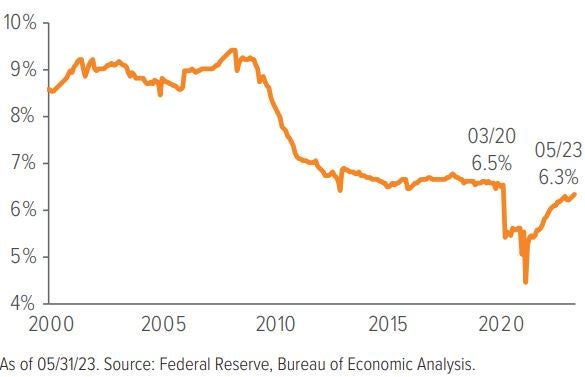
As of 05/31/23. Source: Federal Reserve, Bureau of Economic Analysis.
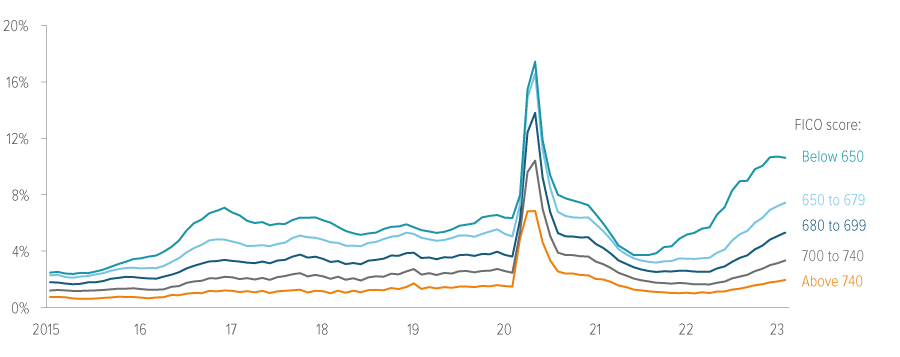
As of 02/28/23. Source: dv01
3. A new leg higher for housing
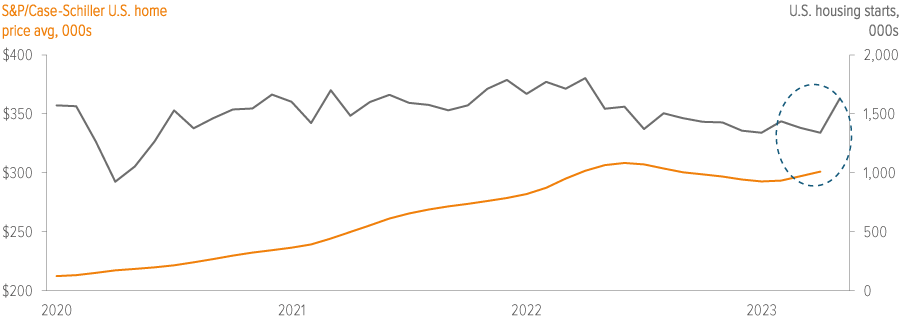
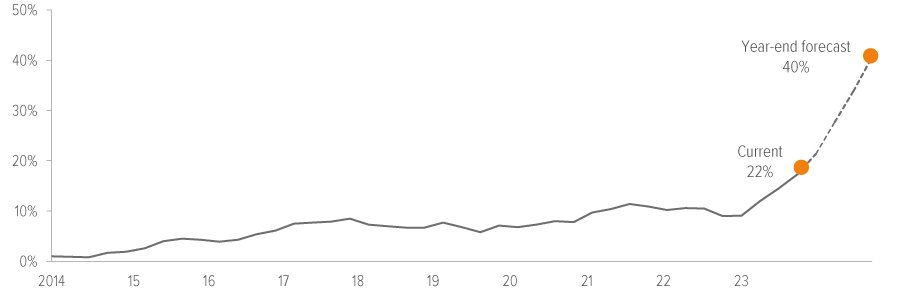
Soaring mortgage rates in 2022 had a chilling effect on the red-hot U.S. housing market. However, the pullback in home prices has been relatively shallow due to the ongoing supply shortage and lack of affordable housing options. The bottoming process is now playing out, with home prices and housing starts turning a corner (Exhibit 5).
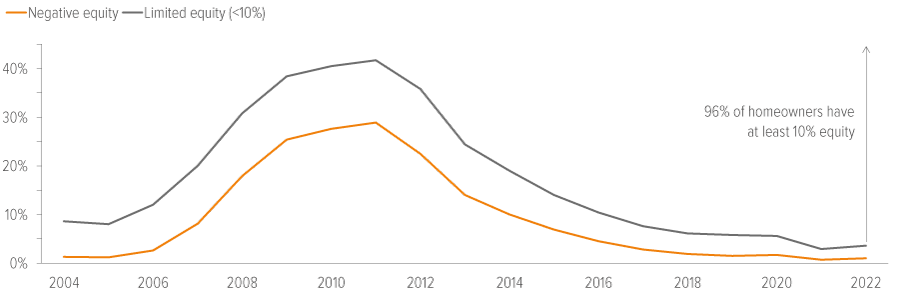
Along the way, mortgage credit has behaved beautifully, insulated from both elevated financing costs and economic uncertainty. About 80% of homeowners have locked in mortgage rates below 5% (the current national average 30Y mortgage rate is about 7%), and aggregate home equity has grown to nearly $30 trillion — equity that households will want to protect (Exhibit 6).
These conditions should allow residential mortgage-backed securities (RMBS) to perform well in a variety of economic scenarios:
- A soft landing would provide mortgage credit with a long runway to grow and thrive.
- A recession would trigger rate cuts that could prompt new refinancing activity and improved affordability.
We see this win/win scenario as a high-conviction way to take risk profitably, almost irrespective of the economic forecast.
What we’re doing in RMBS
Strategy
- We are receptive to taking subordinated risk given the early phase of the housing cycle, strong underlying credit characteristics and our belief that RMBS are likely to deliver across a wide range of scenarios.
- With the sound underwriting for residential mortgage credit that has characterized the post-GFC period, positive views can be expressed across a broad range of collateral types, including prime jumbo, agency investor, agency credit risk transfer and seasoned non-qualified mortgages (non-QM).
- All else equal, less seasoned collateral and higher loan-to-value (LTV) ratios are disadvantaged heading into a potential economic slowdown; structural concessions are required.
Positioning
- Favor prime jumbo overall, including low-coupon pools that offer substantial price discounts, as well as agency-issued credit risk transfer (CRT) M1B, M2 and seasoned B1 tranches.
- Avoid second liens, reperforming and nonperforming loans (RPL/NPL), legacy RMBS and newly issued non-QM with affordability product concentrations.
At 05/31/23. Source: Federal Reserve, Voya IM.
As of 09/30/22 (September data each year). Source: McDash Property Module.
4. With no refis and no resets, can CLOs repay themselves?
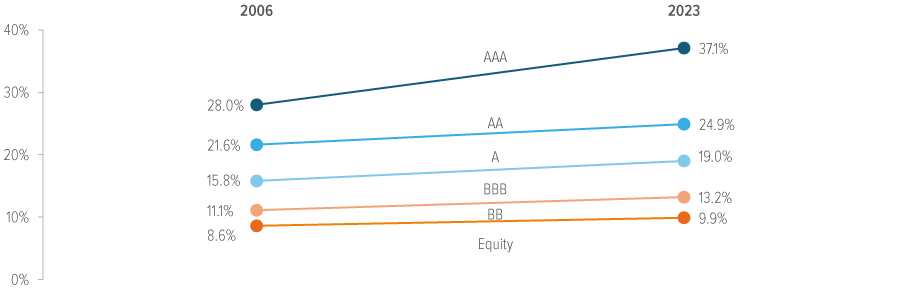
Collateralized loan obligations (CLOs) are among the more cyclical spaces within securitized credit. Returns tend to be correlated with bank loans (which act as collateral for CLOs), whose leveraged profile is more vulnerable to growth concerns. This sensitivity could lead to meaningful volatility from rising defaults and uncertain recoveries. However, investor protections have improved substantially since the financial crisis, and CLO tranches have much more subordination — meaning collateral losses would need to reach higher thresholds before a tranche incurs a loss (Exhibit 7). For most investment grade–rated debt classes, we believe these protections should be sufficient to absorb losses this cycle. (In the post–financial crisis era, no investment grade CLO — using S&P as a proxy — has ever defaulted.)
Of potentially more significance is a situation unique in the history of the CLO market. By the end of the year, nearly half of current CLO deals in the market will exit their reinvestment periods and begin to amortize (Exhibit 8), with typical extension options virtually nonexistent. Extending the reinvestment period for transactions, or otherwise reissuing a deal, requires an excess spread (the “arb”) that’s sufficient to incentivize equity holders. However, due to elevated CLO debt spreads and relatively low underlying loan spreads, the arb currently isn’t big enough to be economical for equity holders. The retreat by banks (normally among the less economically sensitive buyers of CLO AAA tranches) has further exacerbated the situation, making it unlikely to improve in the near term.
What happens if deals can’t be extended? For those with a concoction of loans that can’t be efficiently sold or refinanced, there will be a reckoning, causing potential pain for CLO debt and equity holders, particularly those lower in the capital structure. But for CLOs with well-structured underlying portfolios, loans will continue to refinance, and the deal structures will take in the cash proceeds and repay senior debt classes. This process will make the structures more creditworthy, potentially leading to ratings upgrades down the capital stack.
This combination of cyclical and structural dynamics is creating an inflection point for CLOs that will make security selection paramount. Allocating to the space may be more challenging in the near term given the frontend nature of the current credit cycle downturn. However, as typically happens with turns in the cycle, opportunities will emerge to become more aggressive seekers of risk. For now, discipline is warranted, as conditions are evolving in historic fashion. The re-emergence of opportunity will arrive, perhaps signaled by the return of the arb, allowing the CLO machine to rev its engine once again.
As of 05/15/23. Source: Voya IM, Kanerai, Intex. Credit enhancement is a structural protection for investors, representing the percentage of credit losses a collateral pool must experience before the specified tranche begins to absorb losses
As of 06/30/23. Source: Barclays.
What we’re doing in CLOs
Strategy
- We are taking a defensive stance on asset allocation as the corporate credit cycle worsens, with higher defaults and uncertain recoveries.
- We are actively selecting securities for deals exiting their reinvestment period, looking for collateral pools endorsed by our leveraged credit team for their ability to be refinanced. Properly selected discount-priced subordinate CLO classes may offer outperformance.
Positioning
- Own dislocated new-issue A–AAA credits.
- Avoid nearly everything below IG-rated classes and be extremely discerning with all subordinate debt classes in deals outside of their reinvestment period.
- Aggressively seek discount-priced IG-rated subordinates from transactions post their reinvest period, with proper endorsement of the underlying collateral.
5. Green shoots of optimism for securitized allocations
Despite challenges in commercial real estate, securitized credit spreads have stabilized following the bank turmoil in March, generating excess returns from a broad mix of sectors and cementing a more positive tone. Liquidity in the space has also improved, driven by reduced selling pressure from money managers and steady buying from insurance companies and hedge funds. As always, securitized credit sectors feature broad and distinct risk profiles, and the opportunities in each market are specific to the cycles of the underlying collateral, the transaction structures and the technical factors of supply and demand (Exhibit 9).
- Non-agency RMBS and consumer ABS are both in a prime position at relatively early stages of their credit cycles.
- CMBS investors are still searching for clearing levels for triple-B and below risk, but near-term loss expectations have improved, alleviating some selling pressure. The space will eventually emerge in an advantageous, opportunity-rich early-credit-cycle position.
- Fundamentals are strained in loan markets (CLOs) and with lower-income consumers (certain ABS subsectors), and these should be avoided from a portfolio construction standpoint. While these sectors could see support from encouraging economic signals, tight labor markets and a firmer housing market, we believe portfolios can easily be structured to emphasize better risk profiles in the vast securitized ecosystem.
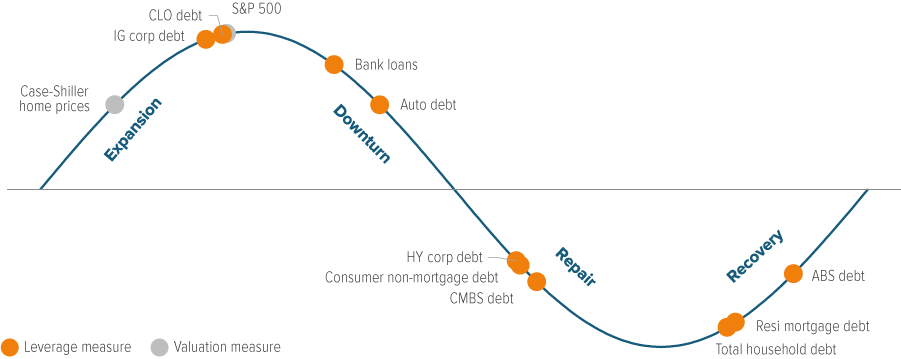
As of 06/30/23. Source: Voya IM, Federal Reserve. Phase assessment predicated on our view that market valuation measures and the sizes of debt markets maintain a relationship with nominal GDP over time. These relationships follow a cyclical, mean-reverting pattern marked by peaks and troughs. Leverage measures (debt markets) assess the size of the market relative to nominal GDP. Valuation measures (asset prices) track the ratio of the index or asset price vs. nominal GDP. Analysis based on available data since 2000.
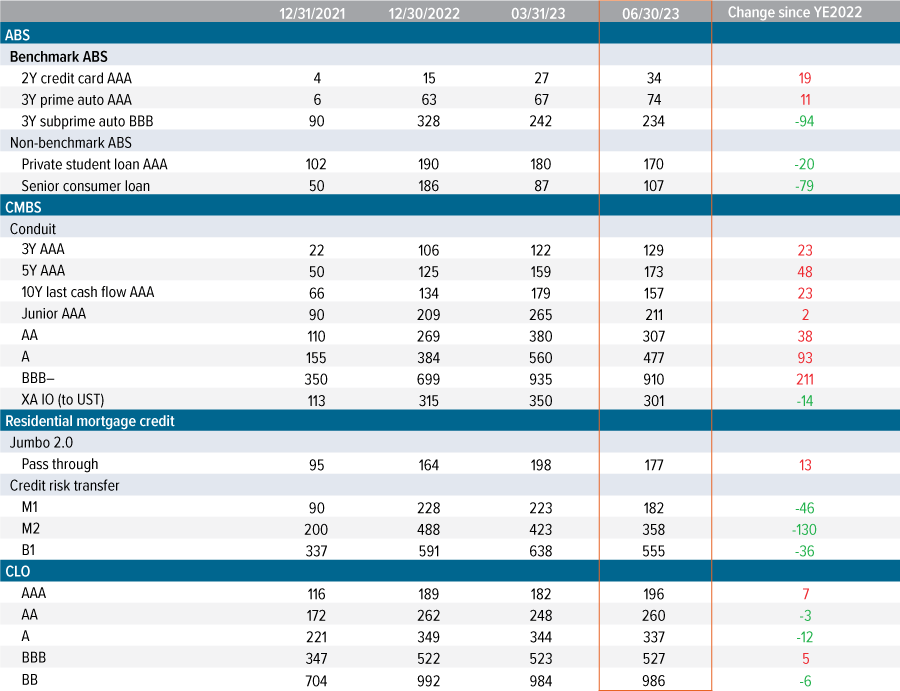
These pockets of opportunity, no matter how compelling, may not be enough to spur stronger conviction in securitized credit as an asset class until commercial real estate prospects improve. Once offices have a clearer path to a new normal, things should get steamy. Ay, there’s the rub: What does an ideal entry point look like? In 2009, 2020 and other past downturns, securitized credit spreads reached “pound-the-table” levels. Spreads today are eye-catching — 477 bp for A CMBS! — and waiting for spreads to widen more in a recession scenario that may never arrive risks leaving investors under allocated. But there are real risks to work through in the near term.
Ultimately, we believe securitized credit is indispensable as a long-term allocation based on its history of diversification benefits, its attractive yield-to-duration characteristics, and the risk-mitigation dimension of credit enhancement.
We have only scratched the surface in this article. We welcome the chance to discuss the nuances of this market in greater depth as you consider an allocation to securitized credit.
Appendix
Securitized spreads summary