Plan Today, Thrive Tomorrow: Designing 529 College Savings Plans

CIO, Multi-Asset Strategies and Solutions

Senior Vice President, Senior Quantitative Analyst

Senior Vice President, Senior Quantitative Analyst

Key Takeaways
For a child born today, four years of college starting in 2042 will cost nearly half
a million dollars for a private university or a quarter of a million for a state college,
underscoring the importance of early and effective college savings.
Our 529 college savings plans help families maximize growth potential through age-based and risk-based strategies, using the Voya glide path model, which optimizes a portfolio’s mix of stocks and bonds over time with respect to a certain spending goal.
These plans offer tax-deferred growth and the possibility of tax-free withdrawals
for qualified education expenses, as well as the flexibility to adapt to evolving
education needs and regulatory changes, making them instrumental in helping
families prepare for college expenses.
Education inflation is a growing burden for American families
Roughly 18.5 million students attended U.S. colleges and universities in 2022.1 At an average annual cost of $24,920 for public universities and $58,600 for private non-profit universities,2 attendance carried a total price tag of around $800 billion.3 (The latest attendance statistics for four-year colleges indicate 36% of students attend private schools and 64% attend public schools.4 )
For decades, the cost of education has risen faster than prices of household goods (the recent inflationary episode notwithstanding). Over the past 40 years, costs of tuition, room and board have increased 5.0% per year for private college and 4.9% for public college, compared with only 2.8% for overall household inflation (Exhibit 1).
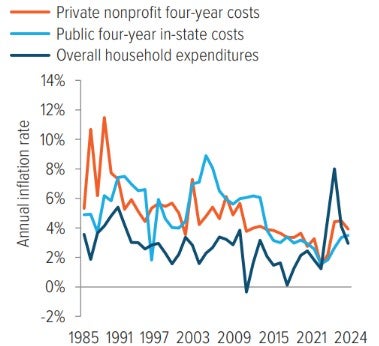
As of 12/31/24. Source: College Board, Bureau of Labor Statistics. College costs include tuition, fees, room, and board. Overall household expenditures inflation is based on the average level of the Consumer Price Index for each year and includes all items in U.S. city average, all urban consumers, not seasonally adjusted.
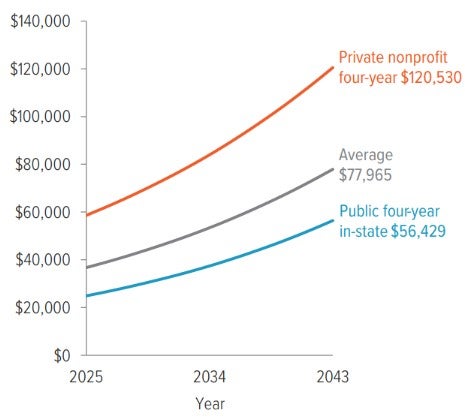
Over the next 18 years, we expect the pace of education inflation to be 4.1% for private institutions and 4.6% for public colleges.5 Based on these assumptions, we expect the average cost for private colleges will grow from $58,600 today to approximately $121,000, and public college expenses will increase from $24,920 to around $56,000 (Exhibit 2).
Financial aid helps, but out-of-pocket expenses remain substantial
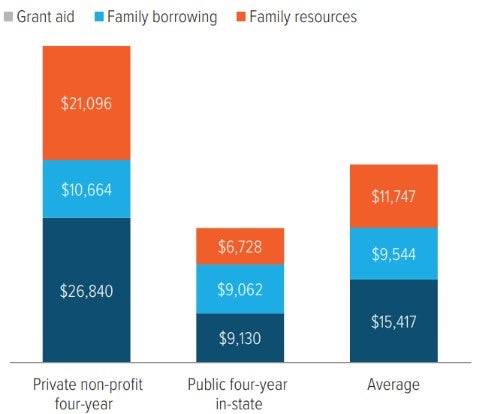
At least three-quarters of students receive financial aid, which can significantly reduce their families’ direct costs for college.6 On average, grant aid covers 42% of college cost, and family borrowing (i.e., loans) covers 26%, leaving 32% to be covered by family resources.7 While individual circumstances determine actual grant and loan considerations, the typical student in 2024-25 covered $11,747 of the $36,708 “sticker” price (Exhibit 3).
The choice of college also significantly affects the direct cost. The average private college student covered an average of $21,096, about three times as much as the average public college in-state attendee at $6,728.
Even with aid, and regardless of college type, four years of higher education requires significant savings. Therefore, families must carefully consider how to invest their assets.
As of 12/31/24. Source: TIAA, College Board, Voya’s 2025 Long Term Capital Market Assumptions, Voya Calculations.
As of 06/30/25. Source: National Center for Education Statistics Integrated Postsecondary Education Data System (IPEDS), College Board, Voya Calculations.
Enter the 529—a tax-advantaged college savings tool
One of the most effective ways for families to prepare for their child’s college expenses is through a 529 plan, named after section 529 of the Internal Revenue Code. These “qualified tuition plans” are designed as tax-advantaged investment vehicles to promote saving for future university or secondary education costs.
Tax-efficient growth
529 portfolios grow tax-deferred, increasing the value of compound growth. Investors may select an age-based portfolio that automatically adjusts the asset mix as the beneficiary ages, or a risk-based portfolio that maintains a constant level of risk ranging from conservative to aggressive, depending on the investor’s risk tolerance.
Tax-free withdrawals for qualified expenses
To avoid penalties associated with non-qualified withdrawals, savers must use 529 assets toward qualified expenses, including:
- College education costs: This includes tuition, room and board, books, and other necessary supplies.
- K-12 education costs: Up to $20,000 in 2026 can be withdrawn from a 529 plan to pay for books, materials, testing fees, dual enrollment fees, educational therapies and tutoring costs, middle or high school tuition, (although some states may have specific restrictions or additional provisions regarding this usage).
- Graduate school costs: There is no limit on withdrawals for graduate school expenses, reflecting the increasing trend of students pursuing advanced degrees. Nearly 23% of college graduates go on to obtain advanced degrees, highlighting the relevance of this flexible use of 529 plan funds.8
Enhanced flexibility
The SECURE 2.0 Act, which took effect in 2022, introduced a significant update for 529 plan beneficiaries. For accounts at least 15 years old, investors who find themselves with excess funds in a 529 plan now have the option to transfer unused funds to a Roth IRA, subject to certain restrictions. This flexibility helps in managing savings more effectively, ensuring that money saved can still be used to support the beneficiary’s financial future, even if it is not needed for education expenses. It also makes 529 plans more appealing by allowing investors to optimize their financial resources in planning for retirement. We believe it is a thoughtful provision for those who may have overestimated their education funding needs or whose education paths have changed
How we construct college savings plans: The Voya glide path model
Voya Investment Management helps people save for all types of financial goals—college education, retirement, emergency savings and more. Our 529 investment portfolios were designed using the Voya glide path model, which optimizes a portfolio’s mix of stocks and bonds over time with respect to a certain spending goal. This model incorporates principles from lifecycle investment theory and economic utility theory:
- Lifecycle investment theory integrates decisions regarding savings, investments and consumption over different stages of life. It helps in planning how assets should be allocated as participants move closer to their financial goals.
- Utility theory explains individual portfolio and consumption choices under uncertainty. Risk tolerance, a characteristics of individual attitudes towards risk, is investor-specific and changes in response to market uncertainties and unexpected changes in inflation and spending targets.
Using lifecycle investment theory, we constructed a year-by-year model of portfolio contributions, asset allocation, and tuition payments. The objective of our 529 glide path model is defined by the tuition coverage ratio, aiming for the savings to reach or exceed the targeted college costs. For our 529 plans, we explicitly model the potential paths of real tuition inflation in excess of household inflation (CPI-U). We assume that saving for college begins at birth and continues until college enrollment at age 18. The savings goal is set to cover four years of direct college costs for a typical student, which is based on the weighted average of private and public college students described earlier. For the academic year 2024-25, these costs start at $11,747 annually and are projected to rise with tuition inflation for 22 years.
Utility theory helps manage risk effectively when assembling college savings portfolios. Utility curves grant diminishing marginal returns for better outcomes, but conversely, they bestow increasingly negative penalties for worse outcomes. In the model, the distribution of outcomes for a potential glide path is scored based on the utility curve. This has the effect of over-weighting the shortfall scenarios relative to the typical scenarios. The glide path model optimizes for the highest average utility score.
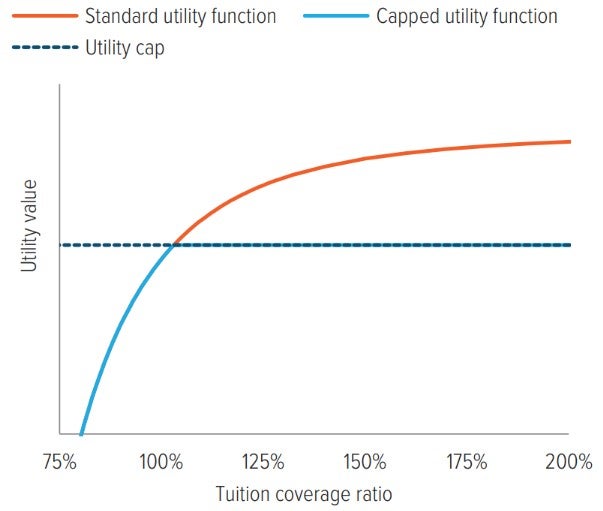
In contrast to our target date funds for retirement savings, our 529 model uses a capped utility function, in which the utility value does not increase once savings reaches the target level (Exhibit 4). We believe this modification more accurately reflects preferences of investors with a specific spending target, particularly within 529 plans where there is a potential penalty for withdrawing excess savings.
After meeting the savings goal, there is no longer any upside benefit in taking a lot of equity risk, but all of the downside risk remains. For this reason, our equity landing point is only 10% for our 529 glide path. In our view, 10% equity is the ideal level for capital preservation to fund the immediate payments necessary for college tuition, while providing modest portfolio appreciation and diversification benefits for the last few years of college spending.
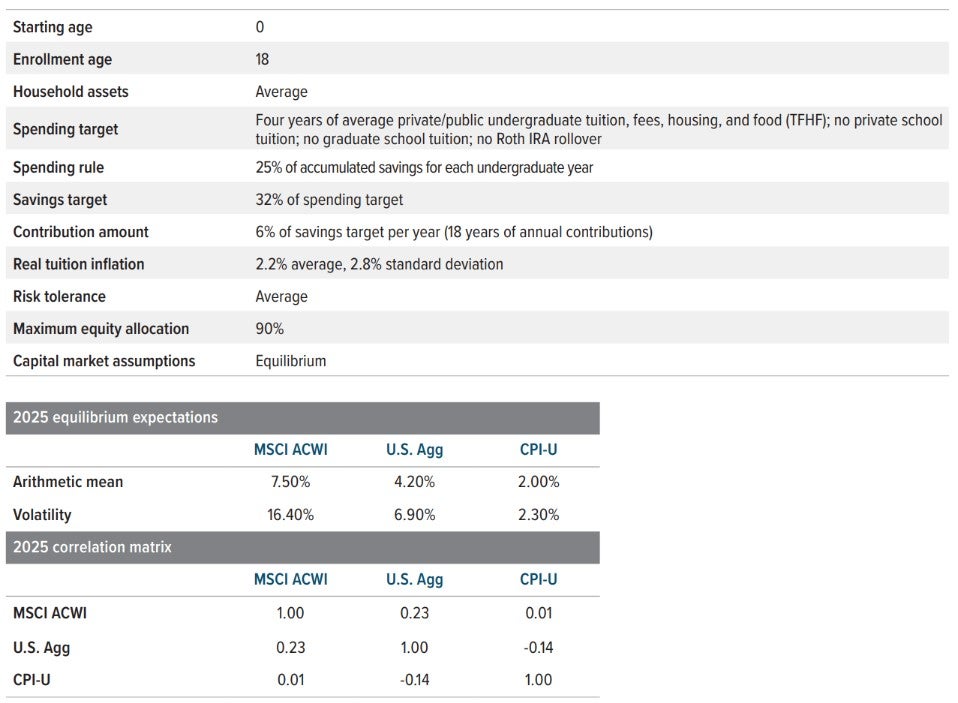
In addition to our utility modeling, we also employ a stochastic framework to analyze tuition coverage outcomes from 50,000 economic and capital market scenarios, focusing on the median outcome and the worst 5% of outcomes. This provides an intuitive approach to compare different glide paths and to analyze the sensitivity of different assumptions. It also allows us to visualize how a particular glide path compares to the “efficient frontier,” which we define as the set of optimal glide paths for different levels of risk tolerance (Exhibit 5). A detailed set of assumptions used in this model is outlined in Exhibit 6. We believe this approach helps navigate fluctuating markets and rising education costs to meet funding goals.
For illustrative purposes only. Not based on actual data. Source: Voya IM.

As of 06/30/25. Source: Voya IM.
Source: Voya IM. See back page for index definitions.
Exhibit 7 illustrates the optimized 529 glide path derived from Voya’s model. This glide path is a strategic blueprint used in constructing our age-based 529 suite of investment portfolios. The design of these portfolios is carefully balanced to manage the tradeoff between portfolio turnover and optimality.
The age-based 529 suite is structured to gradually shift from higher-risk investments to more conservative ones as the beneficiary approaches college age. This shift is meticulously planned based on the optimized glide path, which is designed to reduce exposure to market volatility over time and secure the necessary funds before the expected withdrawal period.
Voya aims to provide a robust investment solution that not only grows with the beneficiary but also adapts to changing market conditions to maintain a trajectory towards achieving the set education funding goals.
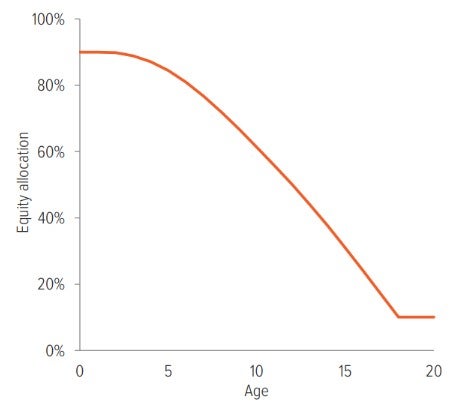
As of 06/30/25. Source: Voya IM.
Participant guidance
How much to save: The 6% rule of thumb
The question of how much to save for a child’s college education can be daunting for many families. The Voya glide path model simplifies this process by integrating factors such as cost of attendance, tuition inflation, and capital market assumptions into straightforward guidelines that families can follow.
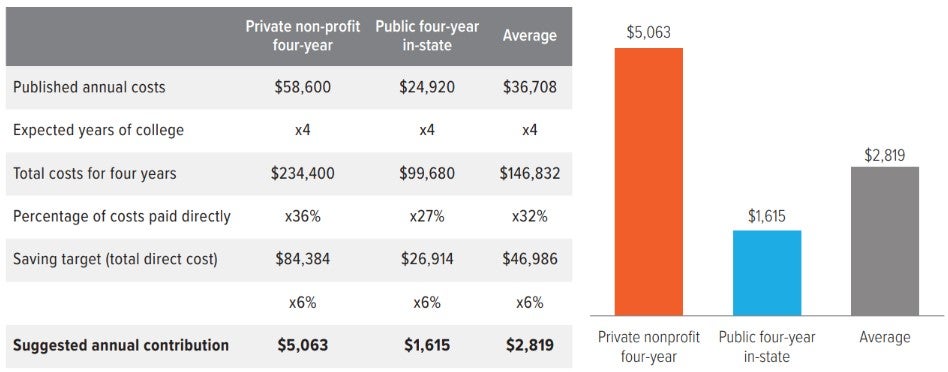
According to the model, families should aim to save 6% of the total projected college costs based on current prices. For the 2024-25 academic year, this translates to an initial annual contribution of $2,819, on average. This amount should be adjusted annually to align with the inflation in college costs. For instance, if the average college cost increases by 5%, then the contribution for the next year should also increase by 5%.
Note that the recommended contribution can vary significantly depending on the type of institution (private or public) and whether the student attends an in-state or out-of-state school. Exhibit 8 illustrates the breakdown for a typical student attending a four-year college program.
While the Voya glide path model offers a useful guideline, it’s crucial for each family to assess their financial situation and decide how much they can realistically save without compromising other financial goals. The model provides a starting point, but personal circumstances and preferences will ultimately guide the final decision on how much to contribute annually to a college savings plan.
The importance of starting early
Starting early in saving for a child’s college education is highly advantageous due to the power of compounding returns over time. The longer the investment period, the more opportunity there is for growth, which can significantly enhance the total savings accumulated by the time the child is ready for college.
Impact of delayed savings
When savings start later in a child’s life, the investment horizon is shortened, necessitating higher annual contributions to meet the same financial goal. This compressed timeline increases the financial burden each year.
Adjustments in contribution rates: According to the Voya glide path model:
- If saving starts at birth, the baseline contribution rate is 6%.
- Starting at age 5, the required contribution rate increases to 8.5%.
- If saving begins at age 10, the rate jumps significantly to 14%.
These increased rates reflect the need to accumulate the same amount of money over a shorter period.
As of 06/30/25. Source: National Center for Education Statistics Integrated Postsecondary Education Data System (IPEDS), College Board, Voya IM calculations.
Conclusion
Voya Investment Management’s approach to managing 529 plans is designed to help families meet the financial demands of funding higher education. Our method is grounded in extensive research and a deep understanding of key factors that affect education savings, including tuition trends, household saving habits and the evolving balance between risk and return over time. It adjusts to market fluctuations, rising educational expenses and specific family needs, thus laying a solid foundation for building education savings.