Fixed Income Perspectives: Everything’s Fine Now? Not Quite

Chief Investment Officer

Even as markets cheer easing trade tensions, the effects of tariff uncertainty may still show up in economic data—and bring renewed volatility with them.
Bonds are doing their job
Amid the latest bouts of equity volatility, bond market performance has returned to form, a welcomed shift after the unusual simultaneous selloff of stocks and bonds in 2022 triggered by the Fed’s sharp reversal of a decade-long near zero interest rate environment.
While yields have come down from their peaks, they remain high enough to offer meaningful income and further downside protection. In other words, bonds are behaving like bonds again, helping to stabilize returns when other assets sell off.
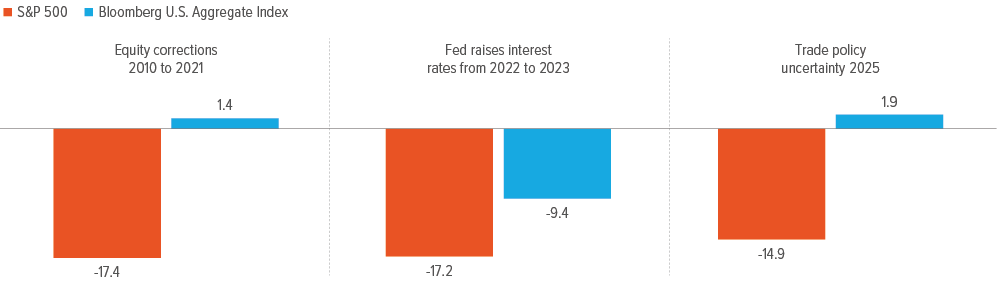
Source: Bloomberg, Standard & Poor’s, Voya IM. For the periods in 2010 through 2023, data was calculated using the average cumulative returns of the indices during the nine equity market correction periods since 2010. Correction periods are defined as price declines of 10% or more. The most recent correction shown is year to date through 04/08/25. Investors cannot invest directly in an index.
Policy-lagged volatility: Back to the future?
At first glance, today’s environment looks more stable than the early pandemic era. Consumers are employed, wages are holding up, and the economy continues to grow. Sentiment, however, tells a different story.
During the pandemic, people faced extreme uncertainty, but fiscal stimulus provided a powerful financial backstop. Today, it’s the reverse: consumers have jobs, but confidence is eroding, and there’s no expectation of a comparably sized fiscal stimulus package on the horizon. That disconnect—solid labor data alongside fragile sentiment—is a setup for volatility.
Add in the lagged effects of recent trade disruptions and the potential for more policy surprises, and the risks become clear. We may not be headed back to 2020, but the road ahead could feel just as unsteady.
Same playbook, more precision
Our overall sector views remain largely unchanged. When taking credit risk, our preference skews heavily toward higher-quality and shorter spread-duration assets with an emphasis on liquidity, and a bias towards securitized sectors given their insulation from ongoing trade concerns. In today’s higher-for-longer rate landscape, coupled with slowing economic growth, lower-quality issuers will likely begin feeling some strain, and we do not believe spreads at current levels compensate for moving down the credit risk spectrum.
As monetary policy uncertainty persists, these firms—especially those with thin margins and heavy refinancing needs—face mounting pressure, which trade policy uncertainty is only exacerbating. That’s why we’re leaning into resilience. Within corporate credit, we continue to focus on issuers with strong balance sheets and pricing power—traits that support durable cash flows in slower economic growth environments. Sector exposure still matters, but in this environment, what you own matters even more.
Note on Moody’s U.S. debt downgrade On May 16, the U.S. lost its last remaining AAA rating when Moody’s downgraded it from Aaa to Aa1 and changed the outlook from stable to negative, citing elevated government debt and interest payment ratios relative to similarly rated sovereigns. The Treasury market initially reacted with a bear steepening, but by the end of the day, yields across the curve were down 1.5 -3 basis points. Ratings agencies are typically backward looking in their analysis, although there can sometimes be a symbolic signaling effect when a big move such as this is announced. Given the very muted moves in yields and spreads, this was largely a non-event from a market perspective. Investors may seek additional term premium further out the curve due to the potential fiscal impact of the administration’s proposed tax cuts. Moody’s downgrade will likely result in higher interest expense in the long run. With nominal growth around 4%, we do not believe the 10-year yield is likely to move meaningfully higher from its current level for a sustained period, as higher rates will start hurting activity (as we are already seeing with housing). |
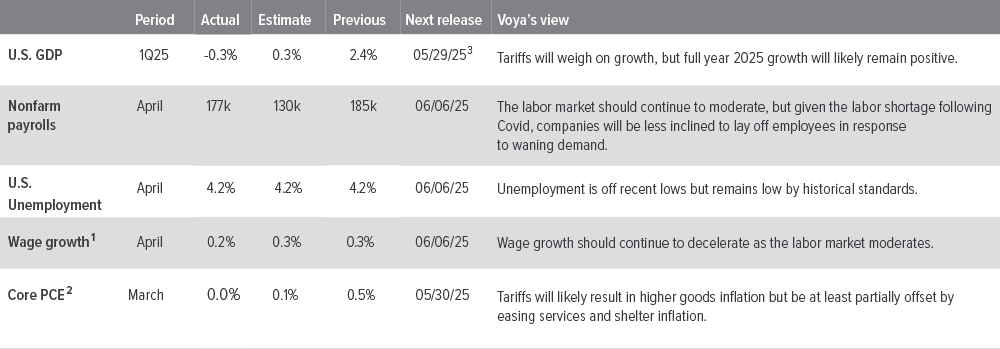
As of 05/19/25. Source: Bloomberg, FactSet, Voya IM.
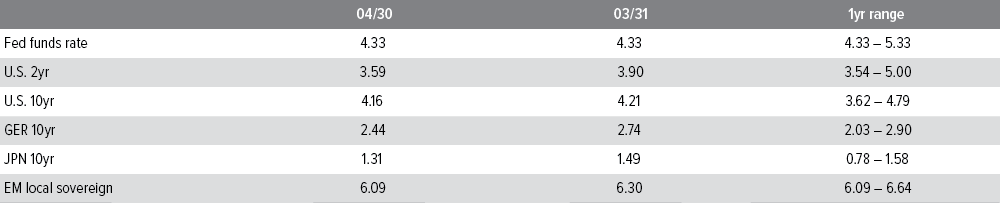
As of 04/30/25. Sources: Bloomberg, JP Morgan, Voya IM. See disclosures for more information about indices. Past performance is no guarantee of future results.
Sector outlooks


- 1Q25 earnings were generally solid, with the impact from trade policy causing some management teams to pull activity forward in late March. Most companies declined to provide guidance, which, so far, has not been punished by the market.
- We continue to keep IG risk low as spreads have moved back to the low end of their historical range.
- We remain underweight BBBs and favor higher quality names in this environment.

- Unless tariff tensions reignite, spreads are likely to remain tight over the next six months, but the risk of negative sentiment in real activity is increasing and leaving the distribution of spread outcomes more balanced.
- From a technical perspective, high yield continues to benefit from a very light new issue calendar.
- While corporate balance sheets entered the tariff-induced uncertainty in a solid position, businesses and consumers are not likely to respond with the usual level of spending, hiring and investment until future trade policy is more clearly defined.

- The overall carry should continue to boost performance on both a total return and excess return basis, and the recent decline in loan prices has improved the valuation of the asset class.
- Recent market volatility presented an opportunity to reposition selectively with specific names and subsectors, especially where stress created mispricings.
- Technical support remains intact, as CLO buyers continue to provide a stable bid to the asset class.

- Despite the recent market volatility and technical moves in the mortgage space, we believe carry is still king.
- Prepay speeds are mostly consistent and stable across the coupon stack, offering opportunities for relative value trades.
- Longer-term, we believe strong fundamentals and a favorable supply technical backdrop should support mortgage returns going forward.
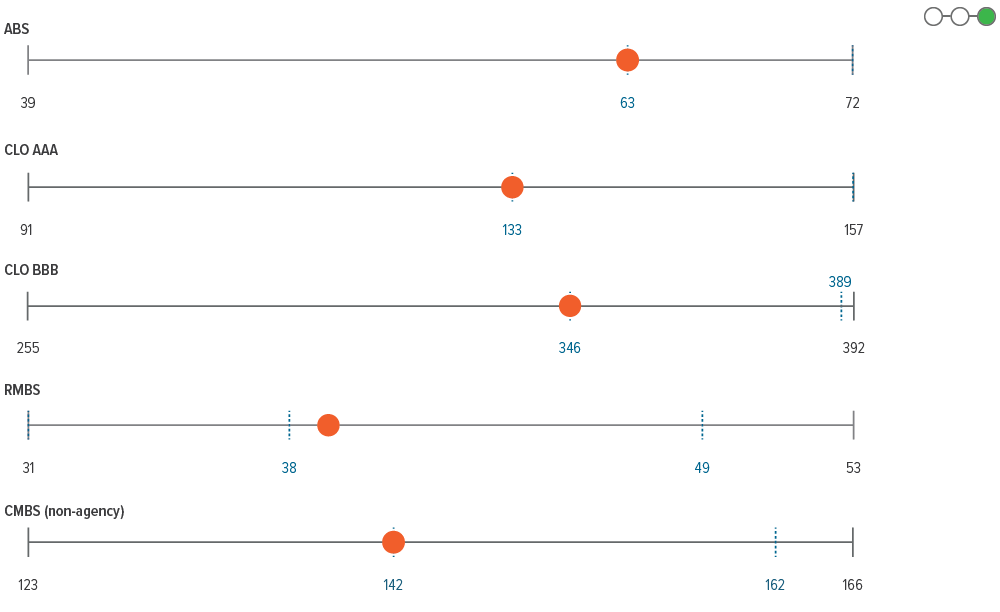
- The fiscally improved profile of the U.S. consumer is in place, although the low-income cohort is challenged. Our bias toward high-quality assets across sub-sectors remains.
- Tariff uncertainty and lower growth expectations will likely continue to challenge valuations for ABS in the short term. However, the sector’s lower beta characteristics should lead to outperformance if volatility were to reignite.
- CMBS remains attractive as tariffs are not expected to immediately impact retail and industrial property types. In addition, we expect risk appetite to continue to improve for offices and remain robust for hotels and multifamily.
- Strong mortgage credit fundamentals and improved valuations should enable RMBS to overcome pockets of weakness emerging in the housing market.
- Weakening technicals and fundamentals make the CLO space susceptible to underperformance. This increases our relative value assessment. We maintain a heavy bias toward CLOs with high-quality managers and strong underlying collateral pools.

- Elevated real yields and softer domestic conditions suggest many EM central banks have room to continue cutting rates, but external factors may limit their flexibility.
- Absolute yield levels remain attractive relative to historical levels despite the recent rally.
- New deals were well absorbed indicating still healthy investor demand given elevated yield levels. Issuance is expected to remain below trend in April.
Glossary of terms OAS: option-adjusted spreads ZV: zero-volatility spread ABS: asset-backed securities CMBS: commercial mortgage-backed securities RMBS: residential mortgage-backed securities CLO: collateralized-loan obligations PCE: personal consumption expenditure YTM: yield to maturity |