Multi-Asset Perspectives: Navigating the New Policy Landscape

CIO, Multi-Asset Strategies and Solutions

Key Takeaways
Policy heightens uncertainty: Disinflation has slowed, and although we don’t think all proposed tariffs will be fully implemented, the uncertainty has markets concerned and is contributing to the Fed’s decision to pause further rate cuts.
Preference for U.S. large and mid cap stocks: Larger U.S. stocks have durable earnings streams, we expect the equity rally to broaden to smaller companies. Japan has shown signs of life, while European fundamentals remain broadly weak. Emerging markets have improved, but China’s fiscal responses raise uncertainty.
High-quality fixed income remains attractive: In the fixed income market, we prefer for higher-quality investments, especially investment grade bonds and securitized credit products, as all-in yields remain attractive.
The current backdrop offers opportunities from stable labor markets supporting strong real household income growth, but policy uncertainty could disrupt markets.
Tactical indicators
Economic growth (solid but slowing)
The U.S. economy grew by an above-trend annual rate of 2.3% in 4Q24. Although growth is decelerating, it’s moving toward a sustainable equilibrium, with manageable inflation and stable labor markets that support strong real household income growth and should allow the Fed to gradually normalize short-term interest rates. However, a high level of policy uncertainty and certain proposed measures could disrupt this balance, especially related to price pressures.
Fundamentals (positive)
With more than 90% of S&P companies having reported, 4Q24 S&P 500 earnings are on track to grow by approximately 17%, with 10 out of 11 sectors delivering positive performance. We expect 2025 aggregate U.S. earnings to grow in the high single digits, aided by lower wage growth and driven by sectors beyond technology stocks.
Valuations (negative)
Large cap U.S. equity forward earnings multiples, while above their historical averages, are backed by robust profit growth and cash flows. Meanwhile, U.S. small cap and non-U.S. equities are trading at a discount relative to U.S. large caps (although discounts are justified for international markets, especially Europe.) U.S. mid caps appear to be attractively priced.
Sentiment (neutral)
Sentiment measures remain mixed, with strong fund flows and light hedging activity, but many survey-based metrics have cooled from extreme responses.
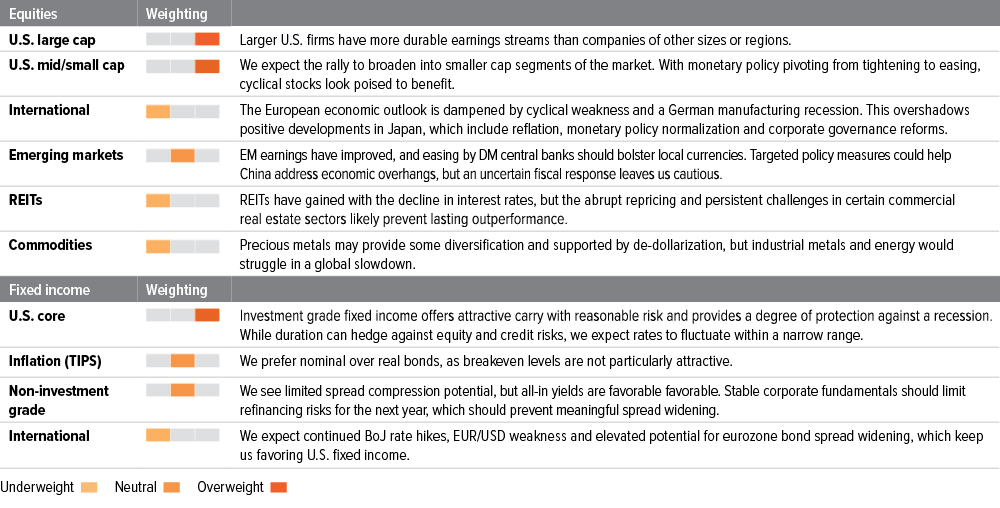
Portfolio positioning
We remain balanced in our view on global stocks versus bonds. U.S. large cap equities and high-quality fixed income are our favorite asset classes.
Investment outlook
Macro environment: Stable growth with higher uncertainty
Global economic prospects generally look solid and should continue to be led by the U.S. Labor markets are healthy, with initial claims trending down and the January unemployment rate declining to a historically low 4.0% (Exhibit 1). Despite some signs of a pause in disinflation—with core CPI moving up to 3.3% in January (Exhibit 2)— we see the latest increase driven mostly by seasonal effects and don’t expect it to translate into a material rise in the Fed’s favored core PCE metric. We think the rate of price increases is manageable and current data support further Fed rate cuts later this year. However, the extent to which the U.S. implements more protectionist measures, and whether or not other policies serve as deflationary offsets, may shift cut projections.
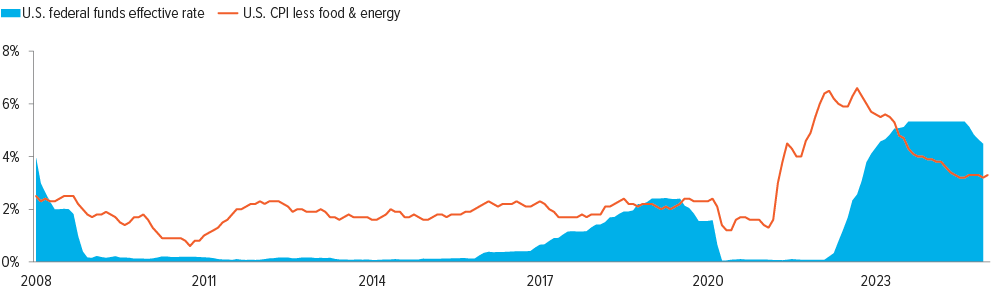
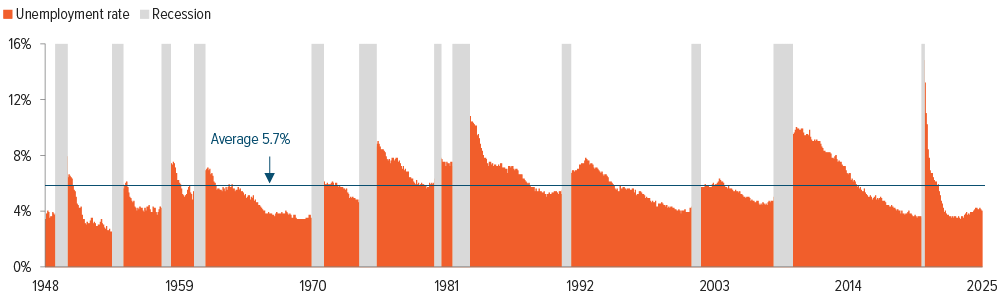
As of 02/13/25. Source: Bloomberg, St. Louis Federal Reserve. Left chart: U.S. CPI urban consumers less food and energy is shown year over year and seasonally adjusted. U.S. unemployment rate in the total labor force is seasonally adjusted.
President Trump’s trade policy changes—including a 25% tariff increase on Mexico and Canada (starting in March, unless they address drug and undocumented immigrant flows across the U.S. border) and a 10% tariff increase on Chinese goods (which has been applied), along with a 25% tariff on all steel and aluminum imports—will likely hinder global economic growth and strain supply chain relationships between the U.S. and other countries. Companies will likely see higher costs for materials and imported finished products, which may lead to higher prices for consumers. We expect companies to use existing strategies for pricing, supplier negotiations, inventory management and reshoring.
We expect additional tariff announcements in the future. However, Trump’s negotiating strategy has historically been to take a shockingly extreme opening position and then compromise toward a more reasonable outcome. While some will certainly be levied, they could be short lived and we don’t believe they will be severe enough to jeopardize economic expansion. Therefore, we will wait to see what policies are enacted and how they’re implemented.
In addition, the Federal Reserve has signaled it is in no hurry to continue cutting interest rates, in light of elevated uncertainty and incoming inflation data; the market is pricing just one cut in 2025.
U.S. equities: Still exceptional, but less so
We continue to favor U.S. equities, especially large cap stocks, due to a better business investment environment given the positive economic outlook, expected deregulation, and increasing merger and acquisition activity. For the first time since 2022, U.S. ISM manufacturing PMI has moved above 50 (Exhibit 3), reflecting improved business sentiment, renewed increases in output and new orders, and steady hiring activity in cyclical areas of the economy. Furthermore, we believe the artificial intelligence (AI) capex boom will continue despite the recent drama involving DeepSeek, which caused investors to question future spending. Hyperscalers set their budgets for 2025 aware of DeepSeek’s open source LLM, and the news may intensify competition and drive greater urgency to invest in this groundbreaking technology. Ultimately, we expect AI investments to boost productivity and advance real growth, maintaining historically elevated profits.
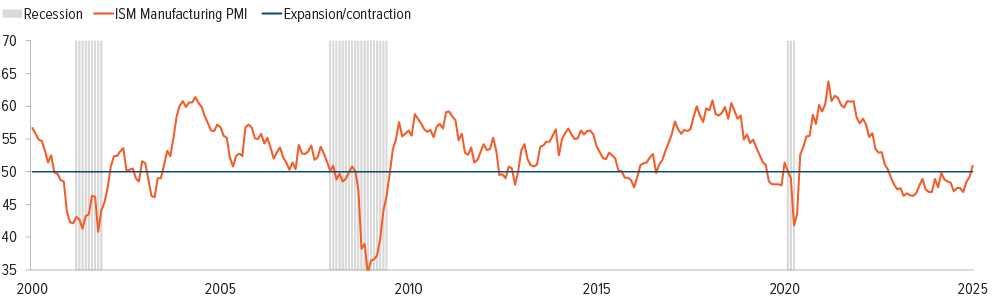
As of 02/13/25. Source: Bloomberg.
We expect earnings growth will broaden out across the U.S. economy, shifting from big tech to more sectors. In 4Q24, 10 of the 11 S&P 500 sectors grew earning year over year and all sectors are forecasted to post positive earnings growth by mid-2025. (Exhibit 4). U.S. equities could receive a further boost as the extension of the Tax Cuts and Jobs Act is clarified, which could further reduce individual and corporate tax rates and extend bonus depreciation for capital investments and research costs.
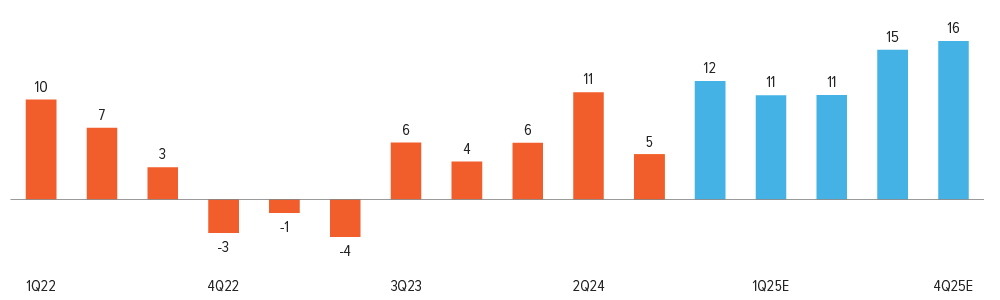
As of 01/28/25. Source: FactSet.
Equity valuation ratios are high relative to history (Exhibit 5). This doesn’t mean prices need to correct, but it does suggest that U.S. equity returns will be lower than in the past two years and more vulnerable to bouts of volatility. Despite the high valuations, the changing composition of the S&P 500, with a growing technology sector and its capital-light business models, indicates that profit margins may have reached a new, higher equilibrium. This shift justifies current valuations and suggests equity returns could align with earnings growth over the medium term. Therefore, we maintain an overweight position in U.S. large cap stocks but have gradually reduced it in favor of mid cap stocks. Mid caps offer improving profitability and more attractive valuations, and they should benefit from cyclical forces gaining traction.
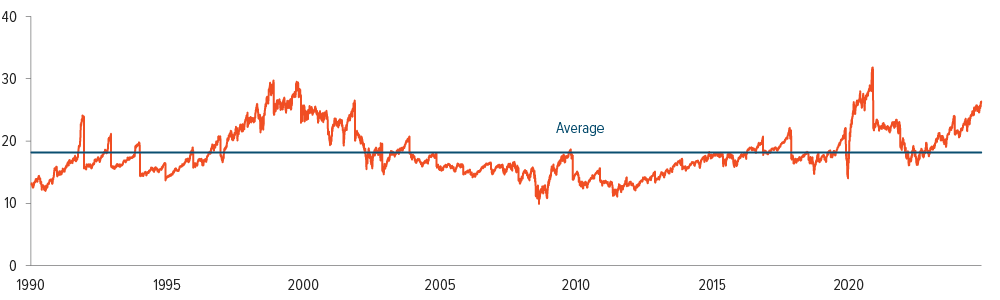
As of 02/13/25. Source: Bloomberg. Chart shows the S&P 500 next twelve months price-to-earnings ratio.
International developed equities: Europe remains mired in economic and political problems while Japan shows signs of recovery
Europe is facing ongoing economic challenges and political uncertainties that may limit its performance. The region remains in stagnation, lagging the U.S. in productivity and technology and struggling with Chinese competition in manufacturing. The European Central Bank’s (ECB) support through easing measures has only partially offset the declining fiscal stimulus in core economies like Germany and France.
Germany is experiencing declining exports (Exhibit 6) due to Chinese competition and the country’s aversion to debt has hampered its ability to counter the cyclical slowdown. However, it has potential catalysts for turnaround: The outcome of the recent election has reshaped the country’s political makeup with conservative parties emerging as leading forces. Christian Democratic Union, which secured the most seats in the Bundestag and will now attempt to form a coalition, has suggested an openness to reforming the “debt brake.” Furthermore, a peace agreement between Russia and Ukraine could ease gas prices, providing relief for Germany and other industrial-heavy European economies. Meanwhile, France is grappling with significant debt and a multitude of political issues.
These problems, along with weak central institutions have hindered effective policy responses and have caused Europe to lose the productivity battle with the U.S. and the manufacturing battle with China over the past decade. Until we see evidence that some of the issues are being rectified, the economic risks remain skewed downward, particularly given the potential impact of tariffs.
Japan has been constrained by demographic challenges and anemic nominal growth but is showing some signs of economic recovery. The country has broken the back of deflation and made progress on corporate reforms, which include efforts to enhance returns on equity and pressure underperforming publicly listed firms to take shareholderfriendly actions. We expect the BoJ to proceed cautiously, but policy normalization that should ultimately benefit the country. Despite the turnaround, there’s been relatively little institutional or retail foreign investment, creating an opportunity as more investors catch on to this compelling growth story. In addition, if the yen resumes weakening, hedging back into U.S. dollars could be favorable.

As of 02/19/25. Source: Bloomberg.
Emerging market equities: Selective opportunities amid challenges
Emerging markets (EM) have encountered several challenges, including a stronger U.S. dollar, limited easing cycles and the threat of escalating tariffs. Despite these obstacles, EM countries have exhibited a diverse and generally improving fundamental outlook.
China, the largest and most significant, has been grappling with deflationary pressures—primarily stemming from its highly indebted real estate sector, which has constrained domestic demand, sentiment and corporate profits, leading to a self-reinforcing downward spiral. China’s private sector and local governments are heavily indebted, which has stifled economic growth. While interest rate cuts have provided some relief, they are insufficient. Instead, the economy could benefit from targeted fiscal stimulus to reignite nominal spending. There are emerging signs of this necessary government support, which will be critical to proposed tariffs threaten China’s export-driven growth model. Although the government is committed to additional steps to stimulate broad demand, the scale and mechanics of these measures— which are critical in determining their effectiveness— remain vague.
The outlook for other emerging countries is nuanced. For example, India maintains a current account deficit with the U.S. and is therefore less exposed trade restrictions. But stock valuations, having benefited from capital flight from China, are expensive. Many Southeast Asian countries could take advantage of increased foreign direct investment, greater participation in global supply, chains and favorable demographic trends, which should drive continued economic growth. However, like China, most of these countries run large U.S. trade deficits and face a looming threat of tariff increases. Therefore, we maintain a neutral stance on EM equities.
U.S. fixed income: An economic hedge with income
In the fixed income market, high-quality U.S. investment grade bonds and securitized credit products are favored for their stable returns and hedge against economic volatility. While the market seems to be pricing additional increases in term premiums on concerns over fiscal policy and debt sustainability, our models indicate U.S. Treasury bonds are trading within their fair value ranges (Exhibit 7).
We think the disinflation trend will help contain rates going forward. As a result, we have neutralized duration in multi-asset portfolios.
Tight credit spreads are expected to persist, but all-in yields remain attractive. This environment provides a healthy carry cushion if rates move higher. High yield spreads don’t offer much additional compensation for the added risk, but we expect credit stress and default risk to remain low.
Our cautious stance on international fixed income aligns with our underweight to non-U.S. equities. While certain countries offer compelling arguments, overall, we believe foreign developed market bonds are not as attractive as U.S. fixed income given their lower yields and the potential for heightened currency volatility.
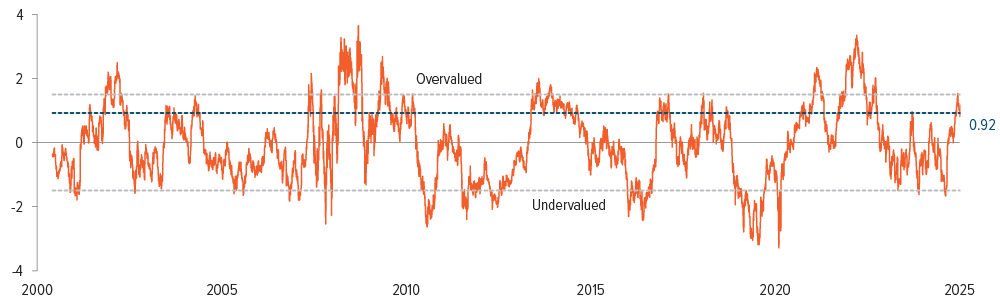
As of 02/14/25. Source: Chart shows the z-score for the 10-year U.S. treasury deviation from fair value. Dashed lines indicate 1.5 standard deviation from mean.