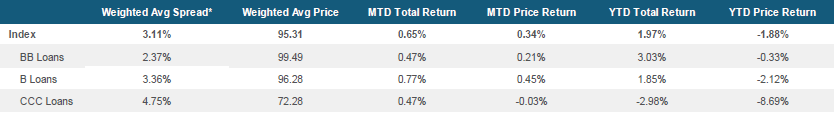
Unless otherwise noted, the source for all data in this report is Pitchbook Data, Inc/LCD. Pitchbook Data/LCD does not make any representations or warranties as to the completeness, accuracy or sufficiency of the data in this report.
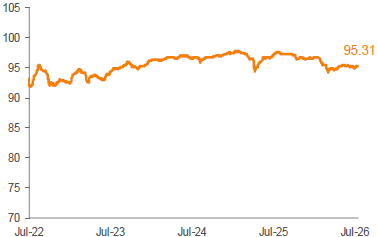
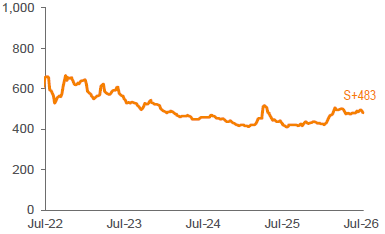
1. Assumes 3 Year Maturity. Three-year maturity assumption: (i) all loans pay off at par in 3 years, (ii) discount from par is amortized evenly over the 3 years as additional spread, and (iii) no other principal payments during the 3 years. Discounted spread is calculated based upon the current bid price, not on par. Please note that Index yield data is only available on a lagging basis, thus the data demonstrated is as of July 10, 2026.
2. Excludes facilities that are currently in default.
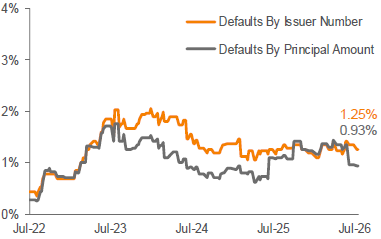
3. Issuer default rate is calculated as the number of defaults over the last twelve months divided by the number of issuers in the Index at the beginning of the twelve-month period. Principal default rate is calculated as the amount defaulted over the last twelve months divided by the amount outstanding at the beginning of the twelve-month period.
General Risks for Floating Rate Senior Loans: Floating rate senior loans involve certain risks. Below investment grade assets carry a higher than normal risk that borrowers may default in the timely payment of principal and interest on their loans, which would likely cause the value of the investment to decrease. Changes in short-term market interest rates will directly affect the yield on investments in floating rate senior loans. If such rates fall, the investment’s yield will also fall. If interest rate spreads on loans decline in general, the yield on such loans will fall and the value of such loans may decrease. When short-term market interest rates rise, because of the lag between changes in such short-term rates and the resetting of the floating rates on senior loans, the impact of rising rates will be delayed to the extent of such lag. Because of the limited secondary market for floating rate senior loans, the ability to sell these loans in a timely fashion and/or at a favorable price may be limited. An increase or decrease in the demand for loans may adversely affect the loans.
This commentary has been prepared by Voya Investment Management for informational purposes. Nothing contained herein should be construed as (i) an offer to sell or solicitation of an offer to buy any security or (ii) a recommendation as to the advisability of investing in, purchasing or selling any security. Any opinions expressed herein reflect our judgment and are subject to change. Certain of the statements contained herein are statements of future expectations and other forward-looking statements that are based on management’s current views and assumptions and involve known and unknown risks and uncertainties that could cause actual results, performance or events to differ materially from those expressed or implied in such statements. Actual results, performance or events may differ materially from those in such statements due to, without limitation, (1) general economic conditions, (2) performance of financial markets, (3) changes in laws and regulations and (4) changes in the policies of governments and/or regulatory authorities. The opinions, views and information expressed in this commentary regarding holdings are subject to change without notice. The information provided regarding holdings is not a recommendation to buy or sell any security. Fund holdings are fluid and are subject to daily change based on market conditions and other factors.
The information contained in this document has been prepared solely for informational purposes and is not an offer or invitation to buy or sell any security or to participate in any trading activity. This document is intended only for professional investors and describes a strategy only. Any products or securities that are mentioned in this document have their own particular terms and conditions, which should be consulted before entering into any transaction.
In relation to all the investment funds mentioned in this document, a Financial Instruction Leaflet or simplified prospectus has been published containing all necessary information about the product, the costs and the risks involved. Do not take unnecessary risk. Read the Financial Instruction Leaflet or prospectus. Investment funds do not offer guaranteed returns and any past returns are not indicative of, nor do they secure, future returns.
The material presented is compiled from sources thought to be reliable, but accuracy and completeness cannot be guaranteed. Any opinions expressed herein reflect our judgment at this date and are subject to change without notice. Neither Voya Investment Management nor any other company or unit belonging to Voya Financial, nor any of its officers, directors, or employees accept any liability or responsibility in respect to the information or any recommendations expressed herein. No liability is accepted for any losses sustained by readers as a result of using this publication or basing decisions on it. The value of your investments may rise or fall. Past performance is not indicative of future results. Investments involve risk. The primary risks of investing in senior bank loans include, but are not limited to, credit risk (the risk that a borrower may default in the payment of interest and/or principal on its loans), interest rate risk (the risk that the yield on an investment will rise and fall in response to changes in market rates of interest), and market risk (the risk that the value of a loan will rise or fall in response to general economic conditions and events). Senior bank loans are typically below investment grade in quality and therefore present a greater than normal risk of default.
This document and the information contained herein is confidential and must not be copied, reproduced, distributed, or passed to any person at any time without the prior written consent of Voya Investment Management. Dutch laws apply to this disclaimer.