Navigating the New Policy Landscape

CIO, Multi-Asset Strategies and Solutions

Despite significant market volatility and policy shifts, the U.S. economy enters a new paradigm with a solid foundation.
Executive summary
- Despite significant market volatility and policy shifts, the U.S. economy enters a new paradigm with a solid foundation. The labor market remained strong but began to show signs of weakness, with higher initial jobless claims in May. Inflation remains under control, and companies continue to report strong earnings. However, the outlook is clouded by new tariffs and the uncertainty surrounding their final levels, making it challenging for companies to navigate the ongoing trade war and operate effectively. In the near term, tariffs may slow growth, boost inflation, and erode profits. In this environment, forecasting becomes more difficult, and it is crucial to diversify portfolios to perform well under multiple scenarios.
- U.S. equities remain resilient: Despite the fanfare international developed equities have enjoyed since the beginning of the year, U.S. equities have quietly regained their leadership. Since the April 21st double-bottom, U.S. equities have outperformed developed international equities by 5%.1We think as the administration pursues more friendly macro polices, such as de-regulation and tax cuts, the more favorable fundamentals in the U.S. will drive equities.
- Quality remains our favorite fixed income feature: We prefer higher-quality investments, especially investment grade bonds and securitized credit products, as all-in yields remain attractive. Corporate fundamentals remain favorable and as long as the U.S. stays out of recession, corporate credit is likely to deliver value.
YTD 2025 review
U.S. equities finished May near where they started the year, recovering from a one-and-a-half-month bear market sparked by “Liberation Day” tariffs that were higher than expected. Fortunately these reciprocal tariff rates were suspended for 90 days on April 9, sparking a bull market and a swift V-shaped recovery. The industrial and utilities sectors led the way, while healthcare and consumer discretionary sectors lagged. Large cap stocks held up better than mid and small cap stocks, and value stocks outperformed growth. On the fixed income front non-U.S. bonds have outperformed U.S. bonds year-to-date while long-term interest rates rose due to concerns over increasing deficits, which negatively impacted long-duration bonds.
For the first time in a while, international stocks significantly outperformed U.S. equities. This shift marked a substantial reversal of the “Trump 2.0” trade that began after the November election, as the administration’s plans to dismantle parts of the post-World War II international system gained momentum. Additionally, the U.S. dollar fell to a three-year low, enhancing returns on foreign assets. Emerging market (EM) stocks, especially those in China, also performed well, driven by government stimulus measures that bolstered economic data and investor confidence. The launch of DeepSeek’s impressive AI model early in the year further drew attention to China’s tech sector, where many companies were trading at much lower valuations compared to their U.S. counterparts.
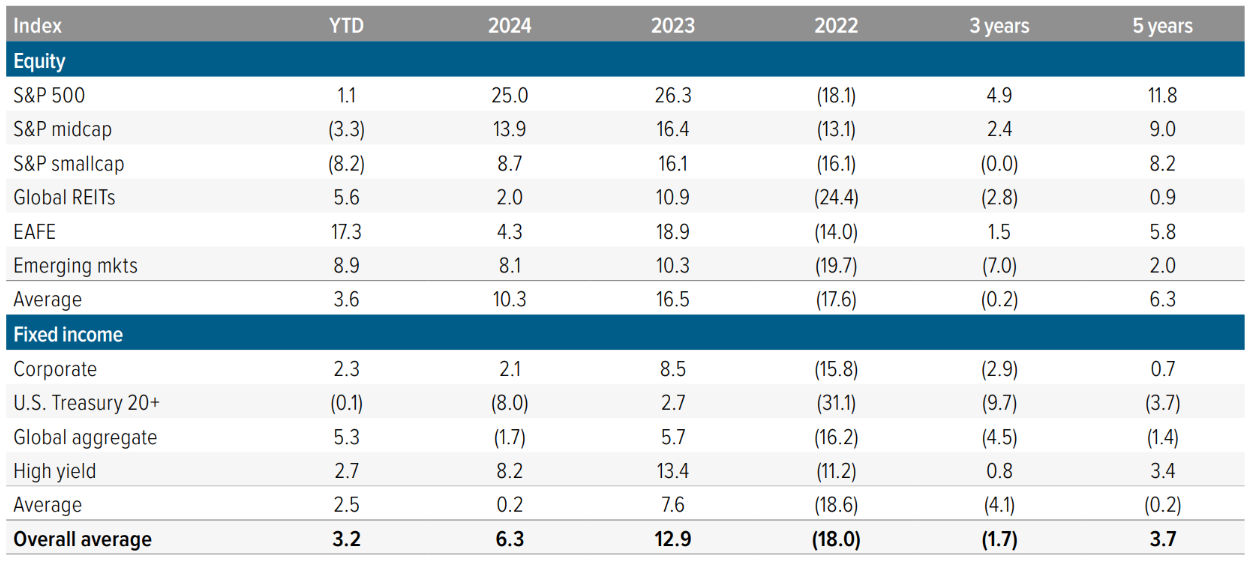
As of 05/31/25. Source: FactSet, FTSE NAREIT, Morningstar, Voya Investment Management. The overall average model allocation includes 10 asset classes, equally weighted: S&P 500, S&P 400 Midcap, S&P 600 Smallcap, MSCI U.S. REIT Index/FTSE EPRA REIT Index, MSCI EAFE Index, MSCI BRIC Index, Bloomberg Barclays U.S. Corporate Bonds, Bloomberg Barclays U.S. Treasury Bonds, Bloomberg Barclays Global Aggregate Bonds, Bloomberg Barclays U.S. High Yield Bonds. Returns are annualized for periods longer than one year. Past performance is no guarantee of future results. An investment cannot be made in an index.
1Q25 YoY S&P 500 corporate earnings stay positive
With more than 90% of S&P companies having reported, 1Q25 S&P 500 earnings are on track to grow by approximately 14%, with 8 out of 11 sectors delivering positive growth. Healthcare, communications and technology sectors led the way, with earnings each rising by 20% or more, compared with this time last year. Energy, real estate and consumer staples sectors saw declining earnings during the period. In aggregate, reported earnings were better than expectations as more than 70% of companies beat.
U.S. equities: Attractive amid ambiguity
Although policy uncertainty, slowing growth, and stubborn inflation create a less stable macro environment, the U.S. economy enters a new paradigm with a solid foundation, which will help it weather this transition better than global peers. This provides a solid underpinning for U.S. equities. While U.S. equity valuations remain relatively high (Figure 3), we value the country’s earnings quality and innovation cycle, particularly in sectors leveraged to productivity and infrastructure investment.
Large caps should perform well even if nominal gross domestic product (GDP) growth slows, given Magnificent 72 business models are somewhat insulated against cyclical downshifts. While small caps may outperform if growth surprises to the upside, we see this as an unlikely scenario. The artificial intelligence (AI) investment cycle remains intact, supported by structural demand for graphics processing units (GPUs) and cloud capacity. Even amid macro uncertainty, spending on AI infrastructure is viewed as mission-critical by corporate CIOs. Furthermore, valuations of high-quality companies have repriced and could gain further with new trade deals, deregulation, or progress on tax cuts. While earnings downgrades are possible, we think the impact will be short-lived.
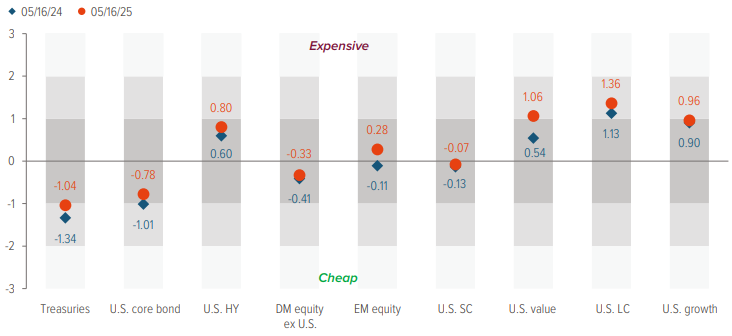
Source: Bloomberg, JP Morgan, Voya IM, as of 5/16/25. Z-score represents how many standard deviations a data point is from the mean of the distribution. Abbreviations: HY: high yield; DM: developed markets; EM: emerging markets; SC: small cap; LC: large cap.
International developed equities: Progress, but caution warranted
Developed international equities, led by Europe and Japan, posted strong performance year-to-date. Stimulus in China and looser fiscal policy in Germany—particularly a surge in defense spending—have lifted investor optimism. But sustaining momentum in Europe will require concrete improvements in industrial production, consumer activity, and capital investment. This remains difficult given the coordination of fiscal, industrial, and trade policies in the eurozone nearly impossible. The disaggregated interests create complexity and slow legislative process. This is unlikely to play well in the current regime marked by rapid change. While the need for improvements could catalyze Europe to come together and create the necessary reform to compete with China and the U.S., history suggests remaining skeptical until evidence shows commitment to dropping ideological differences and narrow self-interests for the broader benefit of the region. In addition, our expectation of a stronger euro (Figure 4) could be a headwind to exports, which are a crucial component of eurozone output.
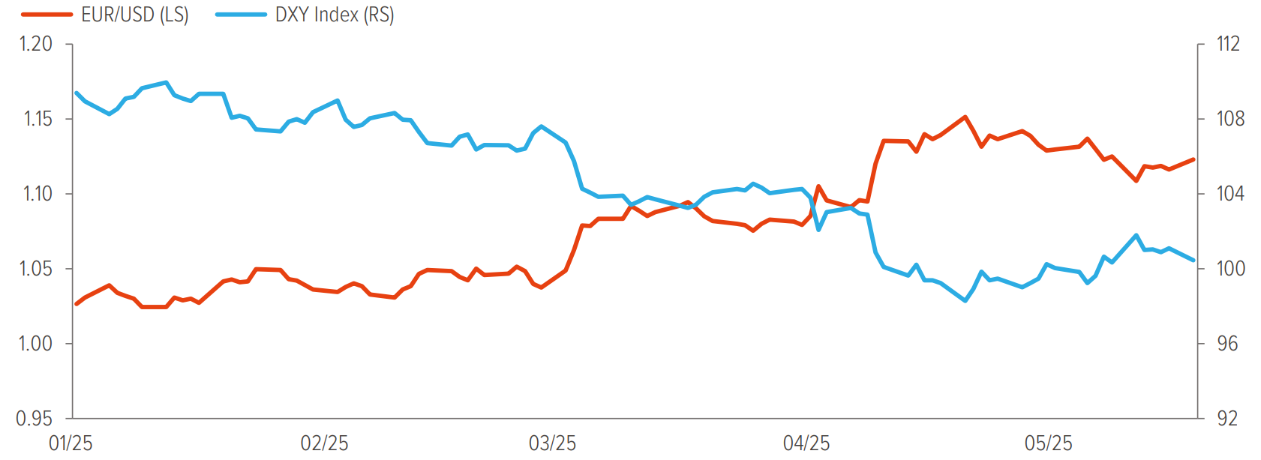
Source: Bloomberg, as of 5/20/25. EUR=euro.
We are neutral on Japanese equities as supportive structural reforms are balanced by external headwinds. Japan continues to benefit from improving corporate governance, with a notable pickup in share buybacks and capital discipline. Stable domestic fundamentals, modestly growing wages, tight labor markets, and a transition from deflation to modest inflation are encouraging households and institutions to rotate into risk assets. However, the recent imposition of U.S. tariffs, particularly on autos, poses a threat to Japan’s export-heavy sectors, while a strengthening yen may further weigh on corporate earnings by reducing global competitiveness. Sluggish demand from China and other key trading partners adds to the uncertainty.
Emerging markets: Still a tariff battleground
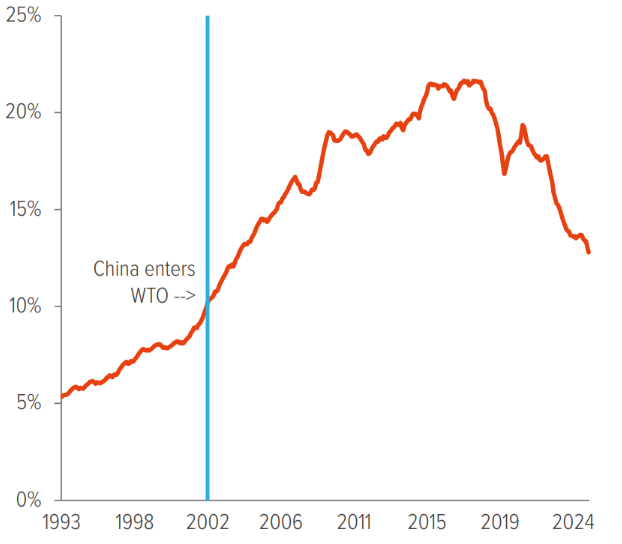
China is the primary target of the U.S. initiated global trade war. China exports more to the U.S. than any other country and has accumulated a massive surplus that the Trump administration wants to reduce. The disintegration of U.S./China trade began because his first term tariffs resulted in China agreeing to enhance intellectual property protections, reduce currency controls, and increase purchases of U.S. goods by $200 billion, which never happened. In his second term, Trump has upped the ante, causing a reconfiguration of global supply chains as China’s share of U.S. imports fell to 2004 levels (which was soon after it entered the World Trade Organization) (Figure 5).
Although paused tariffs are higher than before Trump took office, the temporary reductions in duties are welcome relief for both sides. However, the pause is only for 90-days and nothing concrete has been decided. Given the extreme level of uncertainty, we continue to hold a negative, albeit improving, view of Chinese assets. Despite record low interest rates and yields, credit growth is meager, their property sector remains over-leveraged, and consumer spending is weak. While we expect authorities to unveil fiscal stimulus to offset U.S. tariffs and we were encouraged by President Xi’s recent meeting with business leaders, at which he implied the government will take a friendlier stance toward the private sector, we need to see tangible policy actions before we consider our overall emerging market positioning.
Source: Bloomberg, as of 5/20/25.
U.S. fixed income: Yield with resilience
Fixed income markets have become a battleground for conflicting signals. Policy-induced volatility has driven real yields sharply higher, challenging the traditional safe-haven status of Treasuries. We prefer intermediate duration, investment-grade corporates, as their overall fundamentals remain strong despite a potential slowdown. They offer decent carry without excessive duration risk. Agency RMBS3 and select securitized credit also look compelling, particularly as liquidity has returned to structured markets. The sturdy financial profile of the U.S. consumer, though challenged in the low-income cohort, should hold up well as we expect inflation and rates to stay in a manageable range and growth to remain positive.
High yield corporates could see tighter spreads in the next six months if tariff tensions ease, but the risk of negative sentiment reducing activity is increasing, expanding the distribution of spread outcomes. Emerging markets (EM) present a modest growth outlook, with decent corporate fundamentals and generally prudent financial policies. However, elevated trade uncertainty limits our enthusiasm for this segment. Even as EM debt credit spreads have widened, we see more compelling opportunities within the US, which should benefit from pro-cyclical policies in the second half.
The dollar has weakened considerably since January, an unusual reaction during a period of market stress. This decline reflects concerns over U.S. trade policy, economic protectionism, and fiscal sustainability. While a complete loss of the dollar’s reserve status is unlikely, reduction in global trade could lessen the demand for dollar reserves and Treasuries, potentially impacting the U.S.’s ability to fund itself at low costs. The de-dollarization trend, which has been ongoing since the Global Financial Crisis, is creating opportunities for alternative investment destinations, but no clear contender has emerged to fully capitalize on the dollar’s structural weakness. Currency volatility may continue, but we anticipate the dollar will stabilize over the medium term as trust in the currency is gradually rebuilt, influenced by cyclical, political, and structural factors.
A note about risk: Certain of the statements contained herein are statements of future expectations and other forward-looking statements that are based on management’s current views and assumptions and involve known and unknown risks and uncertainties that could cause actual results, performance or events to differ materially from those expressed or implied in such statements. All investments are subject to market risks as well as issuer, credit, prepayment, extension, and other risks. The value of an investment is not guaranteed and will fluctuate. Actual results, performance or events may differ materially from those in such statements due to, without limitation, (1) general economic conditions, (2) performance of financial markets, (3) interest rate levels, (4) increasing levels of loan defaults, (5) changes in laws and regulations and (6) changes in the policies of governments and/or regulatory authorities.