Achieving Balance: Benefits of the Blend in Target Date Funds

Head of Manager Research and Selection

Senior Vice President, Head of Investment Specialists, Client Portfolio Manager

By combining active and passive underlying investments, blended target date funds may enhance potential returns and diversification over passive-only alternatives while keeping overall portfolio expenses low.
Executive summary
There’s a disconnect between core menus and target date funds. When it comes to investment menus in defined contribution (DC) plans, 86% of plan sponsors have adopted the best practice of offering both active and passive fund options. 1 However, this blended approach doesn’t always carry over to target date funds (TDFs): Only 34% of plans choose TDFs that combine active and passive underlying strategies. Much of this is driven by fear of litigation. But the fact that recent lawsuits have targeted plans with passive TDFs demonstrates that choosing the cheapest option doesn’t shield sponsors from complaints about investment underperformance or fiduciary imprudence.
Even passive TDFs are active. Despite their name, “passive” TDFs—as with all TDFs—require many active investment decisions, including glide path construction, “to” versus “through” landing points at retirement, and others. Such decisions about TDF design have historically caused a 10%+ annual dispersion in net returns among TDFs of the same vintage, overwhelming the 0.30% fee differential that typically exists between passive and blended TDFs.2
Blended TDFs offer potential benefits that single-style options don’t. Because some asset classes tend to be better suited for active or passive management than others, blended TDFs may combine styles selectively to enhance potential returns without meaningfully increasing management fees. Blended TDFs also offer greater asset class diversification than passive options; the seven largest blended TDFs have an average of 14 (versus 5 for passive counterparts).
The Department of Labor offers guidance for evaluating TDFs. When selecting TDFs, sponsors must have a thorough understanding of the plan’s objectives and the participant population. Using Department of Labor guidelines, we offer a step-by-step TDF selection process for sponsors. The essential step is documenting the process as part of fulfilling fiduciary due diligence requirements.
What’s driving the disconnect between core menus and target date funds?
Offering a thoughtful mix of active and passive options within a DC plan’s core investment menu is widely considered a best practice by retirement and investment professionals. Sponsors recognize that a menu that offers a diversified roster of investment managers (and both active and passive management styles) can help them better serve their participants and meet their fiduciary responsibility. In fact, 86% of sponsors surveyed in Callan Institute’s 2025 Defined Contribution Trends Survey offered both active and passive funds in their core investment menus (Exhibit 1)
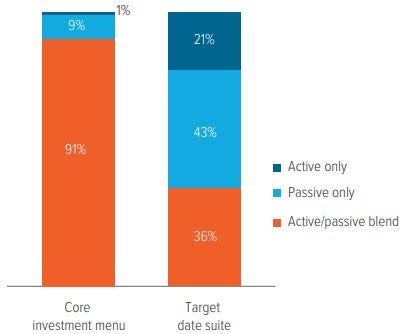
As of 12/31/24. Source: Callan 2025 Defined Contribution Trends Survey. See survey methodology on page 1. Percentages may not sum to 100% due to rounding. Active/passive blend in core investment menus includes both a mirrored approach (an active and passive option for each asset class) and other mixes of active and passive options.
However, this blended approach often doesn’t transfer to sponsors’ TDF selection. Of the DC plans that offered a TDF suite, only 34% used TDFs that consisted of both active and passive underlying investments. Why isn’t there greater alignment between these approaches, with more sponsors using TDFs that blend active and passive underlying strategies? We see several potential reasons, including litigation risk, generalizations about passive funds and macroeconomic considerations.
Fear of class action lawsuits
Passive TDFs are often perceived to be a “safer” option from a litigation perspective (compared with active or blended TDFs), as many lawsuits allege high or excessive recordkeeping and investment fees. As a result, many sponsors believe that offering passive TDFs—which often have lower expenses than other types of TDFs—will circumvent a potential legal minefield. Unfortunately, that’s not the case.
Passive is not a panacea for protecting sponsors from legal action.
The reality is that passive TDFs don’t protect sponsors from lawsuits. Sponsors may be drawn to passive TDFs as a means of protection from participant litigation, but successful lawsuits have generally involved a combination of factors, including a weak process for selecting and monitoring plan investments, underperformance, conflicts of interest, and excessive management and/or recordkeeping fees.
Litigation related to investment underperformance and fiduciary imprudence has increased in the last several years.3 For example, one law firm has filed about a dozen lawsuits on behalf of participants that involve the underperformance of a particular passive TDF suite relative to the five largest TDF suites on the market. There’s also some irony here. In 2014, a court ruled that a sponsor had breached its fiduciary duty by making an investment decision “with virtually no discussion or analysis,” where the “driving consideration” was its risk of fiduciary liability.4 This is a good reminder that sponsors are obligated to act exclusively in the best interests of participants.
Fiduciaries are also not obligated to select the least expensive investment options; rather, the focus should be on the value that an investment offers relative to its cost. The average fee difference between a passive TDF and a blended TDF is only 30 basis points (bp)—but the return dispersion between passive and blended TDFs can be quite wide given the significant differences in investment philosophies and approaches (Exhibit 2).
Fee difference between blended and passive TDFs: 0.30%
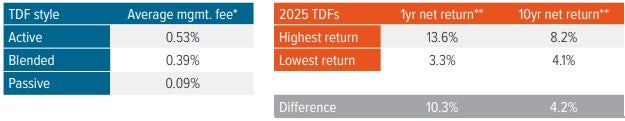
*Source: Sway Research. One basis point (bp) represents 0.01%. Analysis is based on asset-weighted expenses with assets in each mutual fund share class and the prospectus adjusted net expense ratio. CITs are excluded from this analysis. All vintages within each target date series, including income funds, are included in asset-weighted fee and expense calculations. Data as of 06/30/25.
**Source: Morningstar Direct, Voya IM. Right exhibit includes all funds in the Morningstar® Target-Date 2025 open-end category; performance is based on annualized net-of-fee returns. Data as of 06/30/25. Past performance does not guarantee future results.
Performance driver misattribution
Historically, passive U.S. large cap equity funds have outperformed their active peers during times of market strength (Exhibit 3). This asset class generally represents the largest weighting in most TDFs and tends to be the biggest driver of returns. As a result, some sponsors may mistakenly assume the advantage extends to other asset classes.
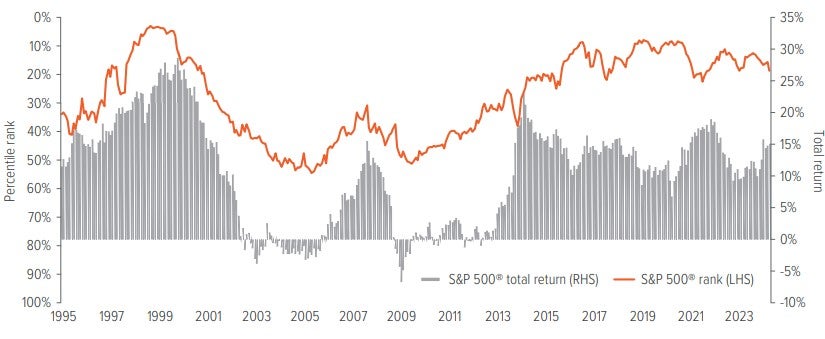
As of 06/30/25. Source: Morningstar Direct, Voya IM. Investors cannot invest directly in an index. Past performance is no guarantee of future results.
However, analysis of the past 30 years shows that the relative advantage of passive or active styles is volatile and varies widely across asset classes and time periods, as shown in Exhibit 4, using index rankings as a proxy for passive strategies. The takeaway is that a blend of active and passive strategies in TDFs may help stabilize excess return volatility.
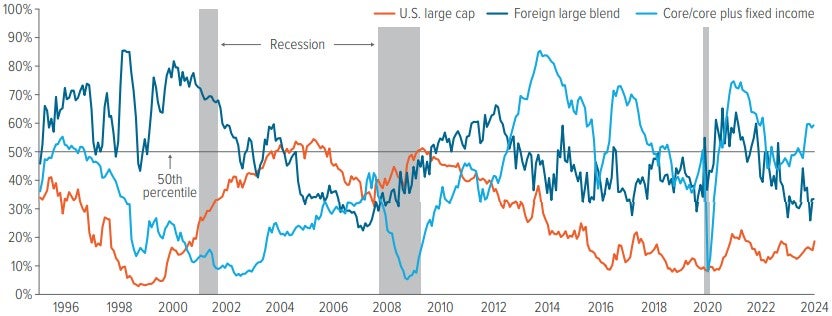
As of 06/30/25. Source: Morningstar Direct. Note: Passive investments in the U.S. Large Cap, Foreign Large Blend and Core/Core Plus Fixed Income Morningstar® categories are represented by the S&P 500® Index, the MSCI EAFE Index and the Bloomberg US Aggregate Bond Index, respectively. Investors cannot invest directly in an index. Past performance is no guarantee of future results.
Macroeconomic considerations
Factors such as interest rate cycles can often influence the chances of active management success. Within equities, the historically low rates that followed the global financial crisis generally shifted favor to passive. However, as rates have normalized more recently, the effectiveness of passive in some asset classes has diminished.
Over the last 15 years, when the 10-year U.S. Treasury yield was below 3%, 28% of MSCI EAFE Index 5-year rolling ranks were below median within the Morningstar® Foreign Large Blend category. This means that passive outperformed most of the active funds in that category in 72% of periods measured. As interest rates rose, the proportion of active managers outperforming also increased, with 96% of MSCI EAFE Index 5-year rolling ranks below median (Exhibit 5).
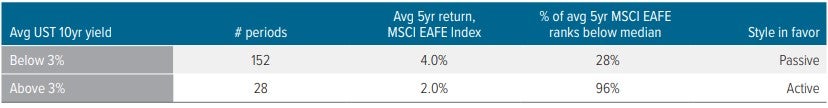
As of 06/30/25. Source: Morningstar Direct, Voya IM. Table includes over 15 years of historical data. Past performance does not guarantee future results. Investors cannot invest directly in an index.
Post-Covid, the Federal Reserve’s aggressive rate hikes to tame inflation negatively affected some segments of the equity market and pushed bonds into bear market territory. Additionally, changes in structural economic drivers— including deglobalization, demographics, decarbonization, remilitarization and ongoing government deficits—may keep inflation higher for longer. These conditions may hinder the performance of some passive equity funds and could pave the way for active managers to outperform.
Active management is becoming less expensive
Beyond a potentially more favorable macro environment for active managers, the costs of actively managed strategies have declined significantly— another reason for sponsors to consider blended TDFs.
Over the past 20 years, the average asset-weighted expense ratio for open-ended mutual funds and ETFs has dropped from 91 bp to 37 bp,5 partly due to the decline in active fund fees. Blended TDFs have benefited from this trend, as they can now access active managers at costs that are more competitive with passive. Exhibit 6 illustrates the decline in the average blended TDF expense ratio, which has fallen from 55 bp in 2018 to 39 bp in 2024.
Many plans now favor collective investment trusts (CITs) rather than mutual funds in their investment menus, resulting in further reduction in the cost of active strategies in TDFs. CITs have fewer regulatory requirements than mutual funds, and their fees can often be negotiated, both at the underlying TDF manager level and at the plan level.
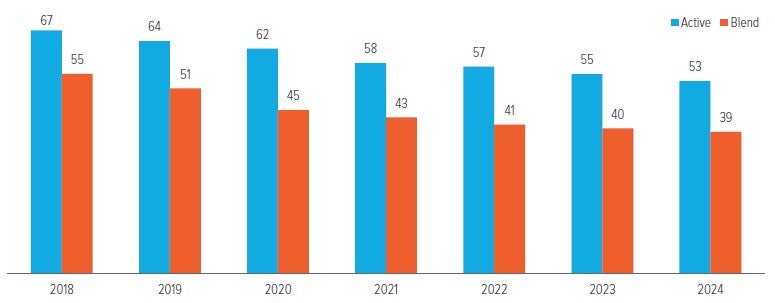
As of 12/31/24. Source: Sway Research, Voya IM. Analysis is based on asset-weighted expenses with assets in each mutual fund share class and the prospectus adjusted net expense ratio. CITs are excluded from this analysis. All vintages within each target date series, including income funds, are included in asset-weighted fee and expense calculations.
Even passive TDFs are active
Despite what the naming convention implies, managers of passive TDFs make many active decisions. Some of these include glide path design, “to retirement” versus “through retirement” landing points, asset allocation and underlying benchmark selection, and rebalancing frequency.
Glide path construction is where some of the largest differences in TDFs can be observed. Each manager uses a proprietary glide path methodology, leading to a wide dispersion of equity allocations among TDF suites. Comparing TDF vintages five years from retirement, the most aggressive TDF glide path had a 55% equity allocation, while the most conservative had a 25% allocation—a difference of 30% (Exhibit 7).
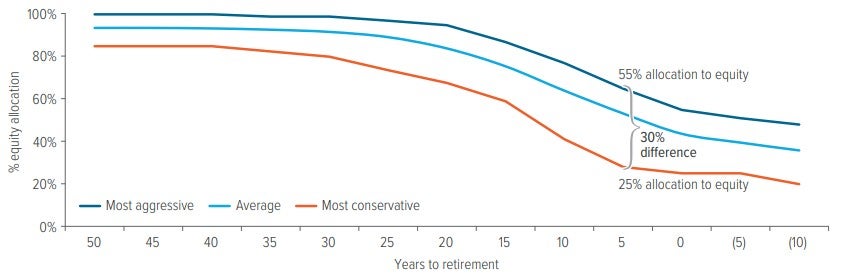
As of 06/30/25. Source: Morningstar Direct. Industry averages reflect stock weights for mutual fund and variable annuity providers. Equity allocations based on years to target (YTT) stock glide path in Morningstar Direct. This data may differ from Morningstar analyst reports, which combine stock and “other.” Exclusions include Invesco Balanced-Risk Retirement Series, Fidelity Simplicity RMD and Fidelity Managed Retirement.
As Exhibit 8 shows, these significant differences in equity allocations often lead to wide dispersions in performance among TDF managers. Over the last 13 years, the best and worst TDFs with a 2030 vintage averaged a difference of nearly 11%.
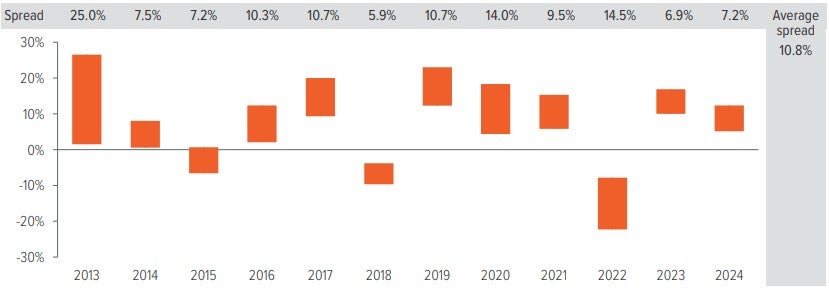
As of 12/31/24. Source: Morningstar Direct. Chart depicts the range of returns for all funds in the Morningstar® Target-Date 2030 category. On average, over the 13 years shown, there were 228 investments each year, including multiple share classes for some funds.
Blended TDFs offer potential benefits that single-style TDFs don’t
Certain asset classes are better suited to a particular style of management
Our decision to use active or passive depends on many factors, including the excess return potential within each asset class, the current market environment and fees. For example, active fixed income managers have historically had a high degree of success outperforming their benchmarks net of fees due to the sheer size and structural inefficiencies of the asset class.
A blended TDF can add value by using active strategies in less efficient asset classes, such as fixed income or non-traditional investments, where the success rate in enhancing returns has been higher. To help trim overall management fees, cost-effective passive strategies may be used in more efficient areas of the market, such as U.S. large cap equity or Treasury inflation-protected securities (Exhibit 9).
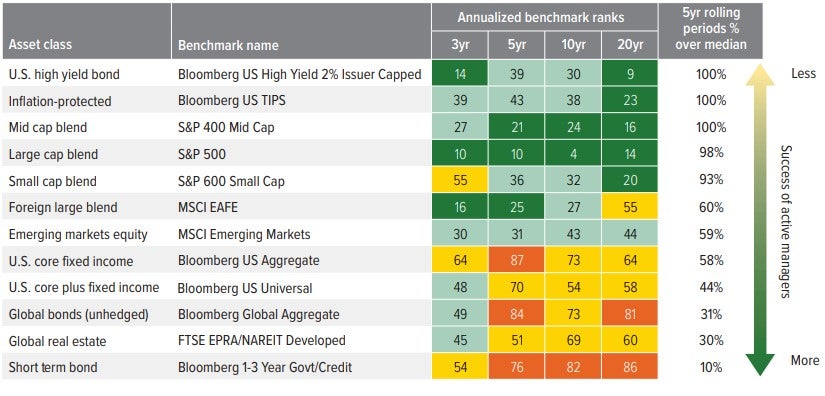
As of 06/30/25. Source: Morningstar Direct, Voya IM. See last page for index definitions. Rankings above represent each index’s ranking relative to the designated Morningstar® peer group. Index returns are net-of-fees applying an investable equivalent expense ratio. The following expense assumptions were made: S&P 500® = 0.04%; S&P MidCap 400® = 0.06%; S&P SmallCap 600® = 0.08%; MSCI EAFE = 0.08%; MSCI Emerging Markets = 0.12%; FTSE EPRA/NAREIT Developed = 0.15%; Bloomberg US Universal = 0.05%; Bloomberg US Aggregate Bond = 0.04%; Bloomberg US High Yield 2% Issuer Capped = 0.20%; Bloomberg US Govt/Credit 1-3 Year = 0.10%; Bloomberg US TIPS = 0.05%; Bloomberg Global Aggregate Bond = 0.20%. Past performance does not guarantee future results. Investors cannot invest directly in an index.
Better asset class diversification
On average, the seven largest blended TDFs allocate to 14 asset classes, while the largest three passive TDFs allocate to five (Exhibit 10). In some cases, blended TDFs also feature tactical asset allocation capabilities, which can lead to potentially better risk-adjusted returns than those returns available to passive TDFs.
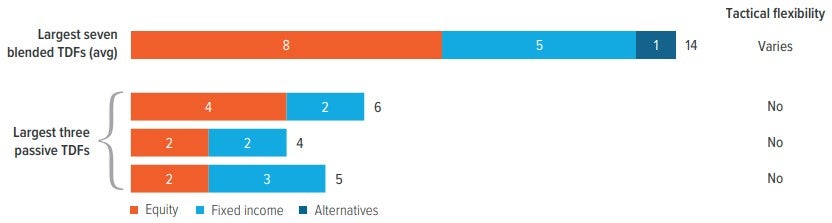
As of 05/31/25. Source: Morningstar Direct. Average of the seven largest blend TDFs. Data on asset classes used based on observed Morningstar® categories and non-categorized money market funds (excluding individual securities, cash and other holdings) in reviewing holdings-based data of TDF suites considered to have a blended investment approach (no more than 85% invested in either active or passive investments).
How should sponsors evaluate TDFs?
Sponsors should document their process and rationale for selecting a particular suite of TDFs. The plan’s approach to its core investment menu can also serve as a guide for determining the most appropriate TDF style.
Before starting the TDF evaluation and selection process, sponsors should have a thorough understanding of the objectives of the plan, including:
- Whether the plan is the primary retirement savings vehicle for participants or is supplemental
- The plan’s philosophy on active versus passive management, single-manager versus multi-manager approaches, and asset class diversification
- The plan’s goal with respect to participant assets at retirement (retain them versus encourage rollovers or distributions)
Participant population is also an essential consideration, including:
- Participant risk tolerances and actual behaviors
- Contribution rates
- How participant salaries are expected to grow over time
- Participant engagement levels with the plan
- Participant investment expertise
In 2013, the Department of Labor provided guidance for sponsors on evaluating and selecting TDFs (Exhibit 11, see next page). Even now, over a decade later, these tips are still relevant.
The process of selecting the most appropriate TDF suite for a DC plan requires a thorough understanding of the product and how it will align with the plan’s objectives, philosophy and participant needs. Deciding on the investment style is just one component of the process, and both active and passive approaches to TDFs can play a role. In our view, however, a blended approach offers the best of both worlds to sponsors and participants.
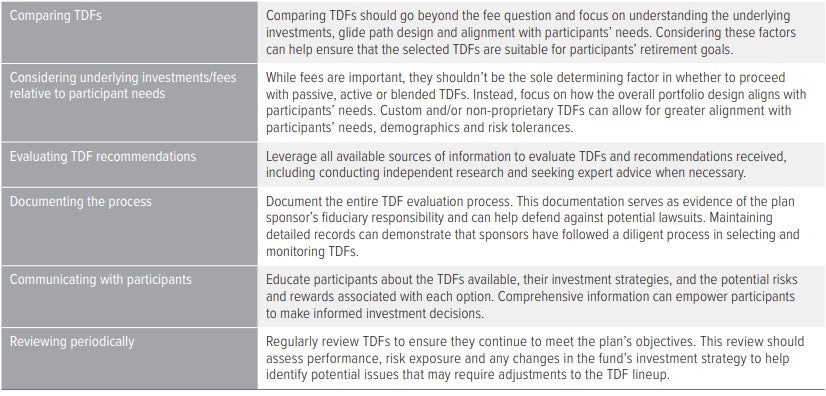
Source: Department of Labor.