
Key Takeaways
Pairing an unconstrained bond fund with a core fixed income strategy may provide a better overall investment experience than a core bond fund alone.
Historical analysis shows that shifting 30% of a core fixed income portfolio to an unconstrained bond fund has improved portfolio efficiency while maintaining a minimum 0.80 correlation to the U.S. Aggregate Bond Index (the Agg).
Unconstrained investing doesn’t mean taking unconstrained risk: Our approach focuses strictly on public fixed income, while aiming to avoid style bias, targets a risk level consistent with bonds, and uses duration posture to manage risk.
A modest allocation to a bond fund that invests across a wider array of sectors and isn’t tied to the Bloomberg U.S. Aggregate Bond Index may help reduce risk and boost return potential.
Benefits of unconstrained bonds
Core bond funds that invest primarily in U.S. Treasury securities, U.S. government agency mortgage-backed securities, and investment grade corporate bonds are the anchor for most any fixed income allocation. However, limiting portfolio exposure to these core sectors may mean missing out on a diverse universe of income and return opportunities in areas such as securitized credit, high yield and emerging market debt.
One approach is to add various singlesector funds and periodically revisit allocations to stay on track. A more opportunistic (and simpler) method is to move some core bond assets to an unconstrained (or “nontraditional”) bond fund. These funds are called unconstrained because they typically have broad flexibility to invest across a variety of securities, with fund managers adjusting the portfolio based on where they see the best opportunities.
We believe this approach offers three compelling benefits that can lead to a better overall investment experience.
1. Improved portfolio efficiency
Using the Morningstar® Nontraditional Bond Fund category average as a proxy for a typical unconstrained bond fund, history shows that blending an unconstrained bond fund with a core bond fund has resulted in superior outcomes, compared with a standalone core bond fund, as measured by the Markowitz efficient frontier of risk and return (Exhibit 1).
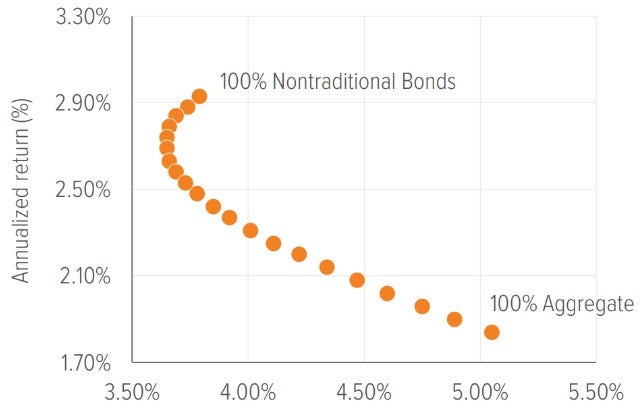
As of 09/30/25. Source: Morningstar Direct, Bloomberg Index Services Ltd., Voya IM. Aggregate (representing a core bond allocation) is the Bloomberg U.S. Aggregate Bond Index (the Agg). Nontraditional is the Morningstar® Nontraditional Bond Fund category average. The efficient frontier graphically represents portfolios that maximize returns for the risk assumed (as measured by standard deviation). Each dot on the frontier represents a 5% change in portfolio allocation between Agg and nontraditional bonds. See disclosures on last page for index definitions. Investors cannot invest directly in an index or category
2. Better risk-adjusted returns
Pairing an unconstrained bond fund with core bonds boosts risk-adjusted return potential, as measured by the Sharpe ratio (Exhibit 2).
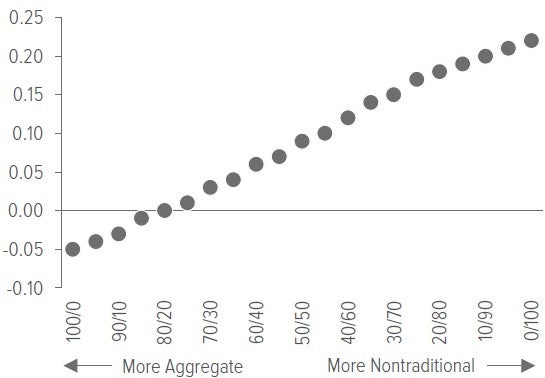
As of 09/30/25. Source: Morningstar Direct, Bloomberg Index Services Ltd., Voya IM. The Sharpe ratio compares the return of an investment with its risk, dividing a portfolio’s excess returns by a measure of its volatility to assess risk-adjusted performance. Aggregate represented by the Bloomberg U.S. Aggregate Bond Index. Nontraditional represented by the Morningstar® Nontraditional Bond Fund category. See disclosures on last page for index definitions. Investors cannot invest directly in an index or category.
3. Significantly less drawdown
In early 2022, the Federal Reserve began its aggressive rate-hiking cycle in an attempt to tame inflation. What ensued was the worst market for U.S. bonds ever witnessed—and the stock market didn’t fare any better. However, unconstrained bond funds substantially outperformed both the Agg and the S&P 500® Index during that period of amplified market volatility (Exhibit 3).
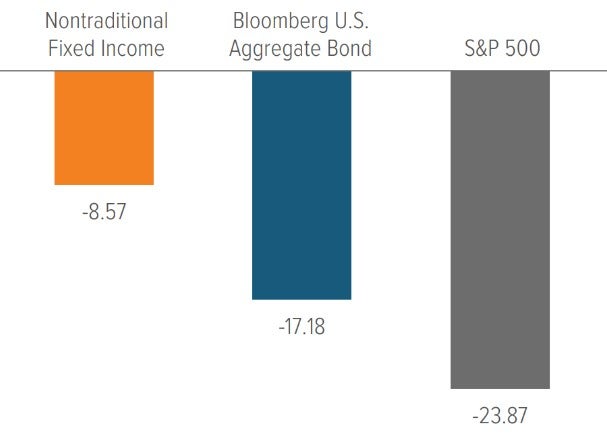
As of 09/30/25. Source: Morningstar Direct, Bloomberg Index Services Ltd., Voya IM. Nontraditional represented by the Morningstar® Nontraditional Bond Fund category. See disclosures on last page for index definitions. Investors cannot invest directly in an index or category.
Striking a balance
Bonds can be an anchor for a portfolio during periods of equity market volatility. In our view, a well-diversified fixed income portfolio is one that maintains at least a 0.80 correlation to the Agg. Having too much allocated to unconstrained bonds (despite their outperformance) could be counterproductive to an investor’s broader portfolio strategy, because the duration of traditional bonds—which measures their price sensitivity, to changes in interest rates—plays a critical role in offsetting equity risk.
Our historical analysis shows that a blend of 70% traditional bonds and 30% unconstrained bonds results in a portfolio that maintains a minimum 0.80 correlation to the Agg—but offers better returns with less risk than a standalone allocation to a traditional bond fund (Exhibit 4).

As of 09/30/25. Source: Morningstar, Bloomberg Index Services, Ltd., Voya IM. Each point represents the minimum trailing 12-month correlation to the Agg for each blended portfolio (Bloomberg U.S. Aggregate Bond Index / Morningstar® Nontraditional Bond Fund category average) for the period noted. Blended portfolios are rebalanced annually to target weights at calendar year-end. Investors cannot invest directly in an index or category.
Voya’s philosophy on unconstrained fixed income
Understanding an unconstrained bond strategy’s philosophy and process is essential; every manager takes a different approach, and manager selection can drive success (or lack thereof) within this category. The different levers an investment team pulls may help diversify risks in an unconstrained bond strategy—or can accentuate them.
At Voya, four key tenets underpin our approach to unconstrained fixed income in the Voya Strategic Income Opportunities Fund (IISIX):
1. Unconstrained fixed income should remain focused on fixed income.
Some unconstrained funds may include allocations to equities, private credit, convertible bonds, or other sectors that simply don’t behave like fixed income. The Voya Strategic Income Opportunities Fund focuses strictly on public fixed income sectors.
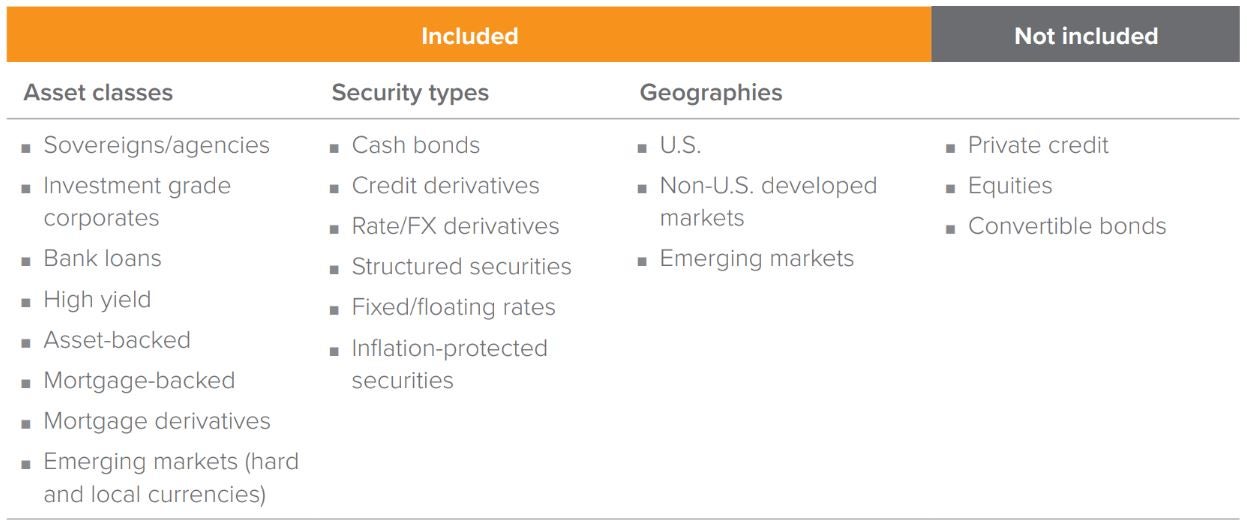
2. Unconstrained fixed income should be free from style bias and maintain low (or no) correlation to both rates and equities.
Maintaining a low correlation to interest rates is standard for most unconstrained bond funds; however, as we mentioned above, some invest in equities and other non-fixed-income asset classes. In our view, the primary reason investors allocate to bonds is to diversify against equity market sensitivity. Accordingly, the Voya Strategic Income Opportunities Fund has a low correlation to traditional rates as well as to equities (Exhibit 5).

As of 12/31/24. Source: Bloomberg Index Services, Ltd., Standard & Poor’s, Voya IM. Rates represented by the Bloomberg U.S. Treasury Index. Equities represented by the S&P 500® Index. See disclosures on last page for index definitions. Investors cannot invest directly in an index.
3. Unconstrained fixed income does not mean unconstrained risk.
While protecting against interest rate risk can be a feature of most unconstrained strategies given their shorter duration profiles, the central objective of the Voya Strategic Income Opportunities Fund is to produce positive performance regardless of market environment. We believe an unconstrained bond fund’s risk profile should be consistent with that of a traditional bond fund. Consequently, the absolute risk objective for the Fund is 200 to 700 basis points (bp), which matches the long-term volatility range of the Agg (Exhibit 6).

As of 09/30/25. Source: Bloomberg Index Services, Ltd., Voya IM. Rolling volatility is measured by standard deviation, which is a measure that helps determine market volatility or the spread of asset prices from their average price. Low standard deviation signifies less price volatility, which equates to lower risk. Investors cannot invest directly in an index.
4. Duration can be an effective tool to manage risk.
Broadly speaking, fixed income managers use two key risk factors to generate returns in portfolios: duration risk and credit risk. Duration is the dominant risk for core bond strategies. While duration profiles vary quite a bit in the nontraditional bond category, credit risk generally dominates the risk budget of these strategies. We believe a duration posture of 2 years is optimal for minimizing the volatility in a credit-focused portfolio.
Why? Over the last 20 years, U.S. Treasury securities (a gauge of duration risk) and U.S. corporate bond spreads (a gauge of credit risk) have generally exhibited a negative correlation (Exhibit 7). Assuming this negative correlation continues, we can project the volatility of a hypothetical credit-focused portfolio at varying duration positions (Exhibit 8). The blue diamond on the orange line (which represents historical volatility) shows that an equal-weighted portfolio of investment grade and below investment grade fixed income securities exhibits its minimum volatility at a duration of 2 years—informing the Fund’s duration tendency.

As of 09/30/25. Source: Bloomberg Index Services Ltd., Voya IM.
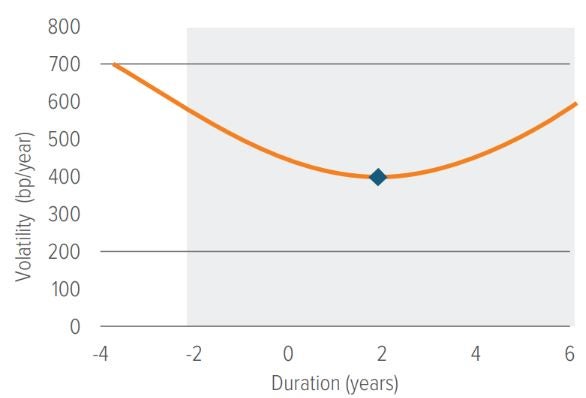
As of 09/30/25. Source: Voya IM. Based on Voya estimates and for illustrative purposes only. Constant credit portfolio with estimates of volatility based on changes in duration
Keeping credit risk constant, overall portfolio risk increases as duration rises or falls from this point. While a duration of two years is the Fund’s long-term central tendency, the unconstrained nature of the Fund allows us to tactically adjust duration above and below this point. However, we limit the Fund’s duration range to between -2 and +6 years. This range keeps the Fund within its stated risk objective of 200 to 700 bp while maximizing flexibility as market conditions change. A broader range would introduce added volatility and the potential to exceed the Fund’s risk budget.
There’s more to explore beyond core
Unconstrained bond funds are not, in our view, intended to replace traditional core bond funds. Rather, we believe their attractive risk and return potential can enhance a core bond allocation within a larger fixed income portfolio.
Given the wide array of investment approaches within the nontraditional bond category, we also can’t overstate the importance of manager selection. An unconstrained bond fund manager should be able to clearly articulate their philosophy and process— especially around the fund’s investable universe and its risk management approach.
A note about risk
All investing involves risks of fluctuating prices and the uncertainties of rates of return and yield inherent in investing. You could lose money on your investment and any of the following risks, among others, could affect investment performance. The following principal risks are presented in alphabetical order which does not imply order of importance or likelihood: Bank Instruments; Company; Convertible Securities; Credit; Credit Default Swaps; Currency; Deflation; Derivative Instruments; Environmental, Social, and Governance (Fixed Income); Floating Rate Loans; Foreign (Non-U.S.) Investments/ Developing and Emerging Markets; High-Yield Securities; Inflation-Indexed Bonds; Interest in Loans; Interest Rate; Liquidity; Market; Market Capitalization; Market Disruption and Geopolitical; Mortgage- and/ or Asset-Backed Securities; Other Investment Companies; Preferred Stocks; Prepayment and Extension; Securities Lending; Sovereign Debt; U.S. Government Securities and Obligations. Investors should consult the Portfolio’s Prospectus and Statement of Additional Information for a more detailed discussion of the Portfolio’s risks. The strategy employs a quantitative investment process. The process is based on a collection of proprietary computer programs, or models, that calculate expected return rankings based on variables such as earnings growth prospects, valuation, and relative strength. Data imprecision, software or other technology malfunctions, programming inaccuracies and similar circumstances may impair the performance of these systems, which may negatively affect performance. Furthermore, there can be no assurance that the quantitative models used in managing the strategy will perform as anticipated or enable the strategy to achieve its objective.


