Excess Capital Yield: A Better Framework for Value Investing

Portfolio Manager and Co-Head of Fundamental Research

Head of Fundamental Analytics

Key Takeaways
Excess capital yield (ECY) provides a deeper, more forward‑looking view of the capital companies have to generate value in a variety of forms.
Factor performance analysis shows that this approach has historically demonstrated a sustained, meaningful advantage — with less volatility than traditional valuation metrics.
ECY’s components provide insights into what levers a company has at its disposal to drive future earnings. Skilled analysts can use these components to generate potential alpha.
After a decade of lagging growth stocks, value investing is seeing a resurgence. But as traditional value metrics used for a century have struggled to remain relevant, we recognize that successful value investors must evolve with the changing market environment. It’s time to reassess how to take advantage of this opportunity through a new lens.
What is excess capital yield?
Value investing, which was first developed by Graham and Dodd in the 1920s, has struggled to remain relevant over the past decade as mega‑capitalization growth stocks have broadly outperformed value stocks. At Voya, we never stopped believing in value investing but recognize that successful value investors must evolve with the changing market environment.
Over the past several years, we have enhanced our large cap value strategy from a cornerstone focus on dividends to a framework we call excess capital yield. In our view, ECY is a more dynamic and effective framework that carries a broader, more consistent and less volatile relative performance profile than more conventional valuation measures. To illustrate these points, we first show how ECY is calculated and incorporated into our investment process. Next, we show how it has been successful over time, both on a standalone basis and compared to other value metrics.
ECY widens the lens on value creation
Historically, the Voya Large Cap Value strategy focused on dividend‑paying stocks, which is a popular investment philosophy rooted in academic literature. History tells us that the combination of steady income and capital appreciation creates the potential to deliver attractive returns over a full market cycle. This remains true today, but it is not without pitfalls. More important, dividend yield is an output, not an input, which is why the Voya value team has evolved its investment philosophy to ECY.
We believe that ECY provides a more holistic view of the amount of capital a company has available to create value, not just in the form of dividends but also in terms of mergers and acquisitions (M&A), share buybacks and internal investments.
We apply our ECY framework to evaluate stocks from a relative value perspective to construct diversified portfolios with higher yields than their benchmarks.
It’s important to note that the ECY focus is not solely on the raw number calculated, but rather on the breakdown of excess capital. The ECY analysis sparks a debate about the state of the balance sheet, sales, margins and earnings power of a company over the next several years, as well as the company’s ability to convert those earnings into shareholder returns. ECY is not a static output; it is a dynamic, forward-looking measure that seeks to quantify the “dry powder” available to management to create value in the form of dividend growth, share repurchases, accretive M&A and organic investment.
Calculating excess capital yield
To determine excess capital, we add free cash flow to cash on the balance sheet and net out dividends. We then employ a balance sheet optimization to capture the competitive advantage afforded to companies with respect to their leverage (relative to that of their peers). Firms with lower leverage have more ability to deploy capital in the pursuit of supplemental value creation, while those with higher leverage have less ability to do so. To find the yield, we divide the raw excess capital number by a company’s market capitalization. This yield is then analyzed on a sector-by-sector basis. Exhibit 1 illustrates this calculation process.
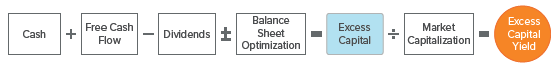
Source: Voya IM.
Does ECY work?
A better performance track record
To quantify the benefits of ECY, we evaluated the factor performance of ECY on both a standalone basis (year over year and sector by sector) as well as relative to other valuation metrics. ECY emerged as the strongest factor (Exhibit 2).

As of 12/31/24. Source: FactSet, analysis by Voya Investment Management. Past performance is no guarantee of future results.
We evaluated the full Russell 1000 Value universe (ex financials, real estate investment trusts or “REITS” and utilities) from 2006 through 2024. REITs and utilities were excluded since neither sector aspires to generate cash, thus making the ECY metric less applicable. Financials were excluded due to lack of data for the sector prior to 2013.
Better risk efficiency
ECY also generated superior historical returns with lower volatility, resulting in the strongest Sharpe ratio compared to these other value metrics (Exhibit 3).
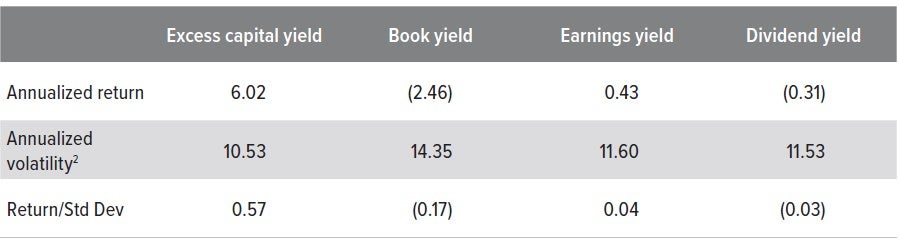
As of 12/31/24. Source: FactSet. Analysis by Voya IM. Past performance does not guarantee future results.
Quality and the avoidance of value traps
At the root of a framework such as ECY, there is a fundamental explanation as to why companies that exhibit an ability to generate excess capital offer fertile ground upon which our analysts can focus their efforts. It is the presence of excess capital that helps to skew the risk/reward opportunity in a stock, amplifying the upside of being right about the company and mitigating the downside if the thesis proves to be wrong. Said differently, it adds a quality element to the strategy and helps avoid value traps, i.e., companies which appear attractive based on conventional valuation metrics but that present insurmountable, fundamental flaws.
To illustrate this point, we measured the correlation of ECY with profitability, high leverage, growth, momentum and beta (Exhibit 4). High ECY companies have exhibited higher profitability (positive correlation) and lower leverage (negative correlation) indicating higher quality.
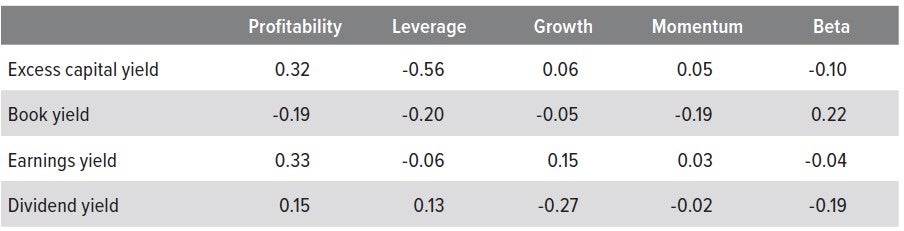
As of 12/31/24. Source: Axioma Inc., Voya IM. This exhibit is for illustrative purposes only and does not reflect any actual product or strategy.
ECY has demonstrated robust, persistent results
As with any back-test, one needs to examine the methodology used, the breadth and depth of the analysis, and whether the results are robust and show some persistence across multiple market regimes. At Voya, our quantitative research team employs a highly disciplined and rigorous approach not only in identifying potential alpha drivers, but also in testing their validity across myriad scenarios. In addition to the results above, we examined the performance of each metric on year-by-year and sector-by-sector bases to evaluate the breadth and depth of ECY, and we obtained similar results (see Appendix).
While these results are encouraging, the framework of ECY was not built just upon a strong back-test. Rather, ECY is a truly “quantamental” metric, which we initially created to provide a holistic, forward-looking view of the capital that management has at its disposal to create value.
How can ECY be used?
The success of ECY is linked to two key benefits:
1. Alpha: As demonstrated in this primer, ECY historically has exhibited stronger and more consistent factor performance than traditional measures of valuation.
2. Framework: The components of ECY provide analysts with insights into what levers a company has at its disposal to generate future earnings.
The second feature is vital, and while this qualitative element is hard to capture numerically, we would be remiss if we failed to note that ECY is much more than a screen to be used by rigid, quantitatively focused strategies. The true value-add comes from the experience of our fundamental analysts, who have the skill and knowledge needed to decompose the number and interpret its meaning in the context of their respective sectors.
In our view, a proper value-oriented strategy should be both dynamic and flexible, capable of accounting for differences across businesses and market regimes as well as complement the individual approaches utilized by fundamental analysts. The success of the Voya Large Cap Value strategy is a direct result of this philosophy, and it is linked to the way we practically apply ECY — triangulating ECY against both other relative. value measures and qualitative, differentiated insights from our experienced team of sector analysts.
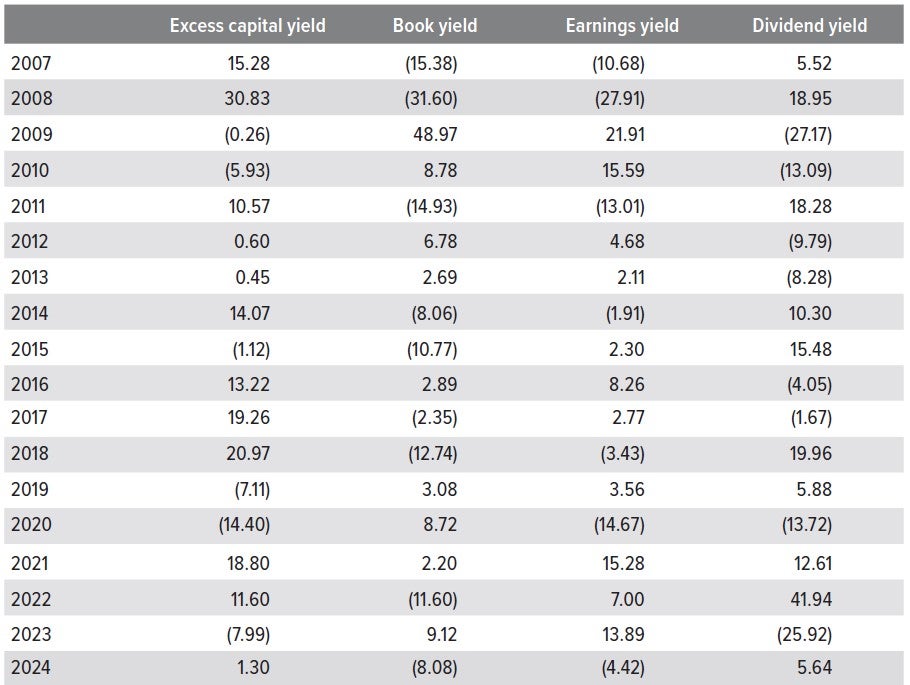
Appendix: calendar year returns
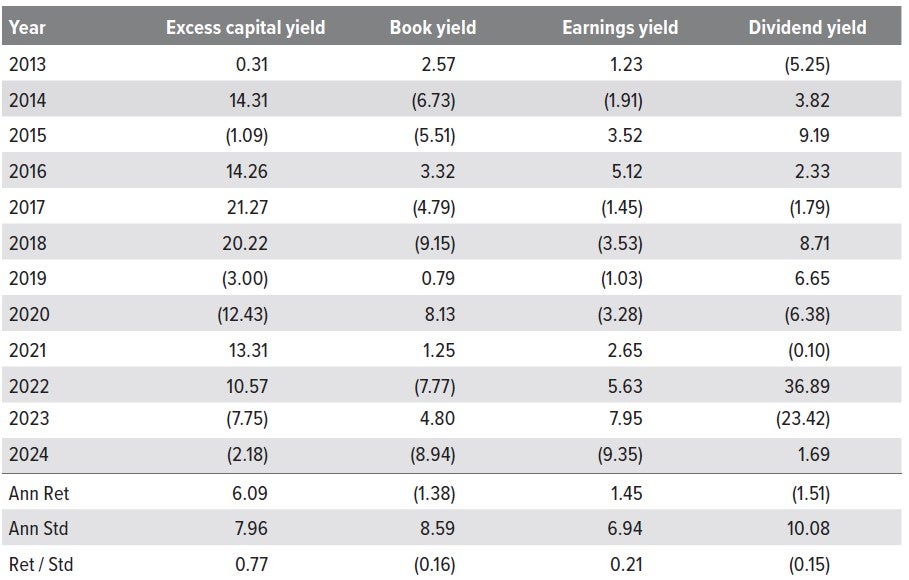
As of 12/31/24. Source: FactSet. Analysis by Voya IM. Past performance does not guarantee future results.
As of 12/31/24. Source: FactSet. Analysis by Voya IM. Past performance does not guarantee future results.
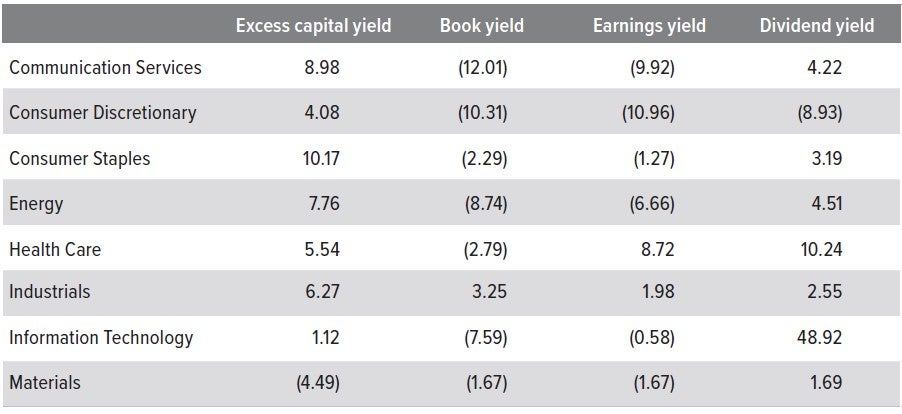
As of 12/31/24. Source: FactSet, analysis by Voya IM, rebalanced monthly. Past performance is no guarantee of future results.