The S&P 500: Diversified Index…or Active Management in Disguise?

Client Portfolio Manager, Large and Mid Cap Growth Equities and Systematic Equities

Senior Client Portfolio Manager, Large and Mid Cap Equities

Head of Fundamental Analytics

Key Takeaways
Investing in the S&P 500 Index today is an active bet on roughly 50 stocks that dominate the benchmark’s performance, likely leaving investors well short of diversification goals.
Some investors worry this concentration may lead to a market bubble and subsequent collapse, but our analysis shows index concentration alone isn’t a predictor of a crash.
Four ways to improve a portfolio’s equity market diversification: allocating to small cap stocks, choosing an actively managed large cap fund, adding exposure to value stocks, and pairing a contrarian or thematic strategy with a passive fund.
When the S&P 500 is more like the S&P 50, passive investing may not be the diversified approach you think it is. Here are some simple ways to broaden your exposure and reduce concentration risk.
Passive investing today is an active decision
A friend of ours who works at a big tech firm was recently asking around about how to diversify her portfolio, given her sizeable position in the company’s stock. A relative suggested she could get broad market exposure by investing in an S&P 500 Index fund. How well did that work?
In theory, the primary goal of the S&P 500 Index is to provide a low-cost, diversified basket of stocks with broad market exposure. Alternately, active investing involves taking deliberate bets relative to the broad market. Today, that distinction has become blurred.
With the massive market-cap growth of big technology and communication services companies, today’s S&P 500 is the most concentrated it’s been since November 1965—effectively representing about 50 stocks, as measured by the inverse of the Herfindahl-Hirschman Index, a common metric of market concentration (Exhibit 1). It’s not just the S&P 500, either: The Russell 1000 Growth Index, whose mega cap weighting is even higher than that of the S&P 500’s, is dominated by just 19 companies, based on the same analysis.
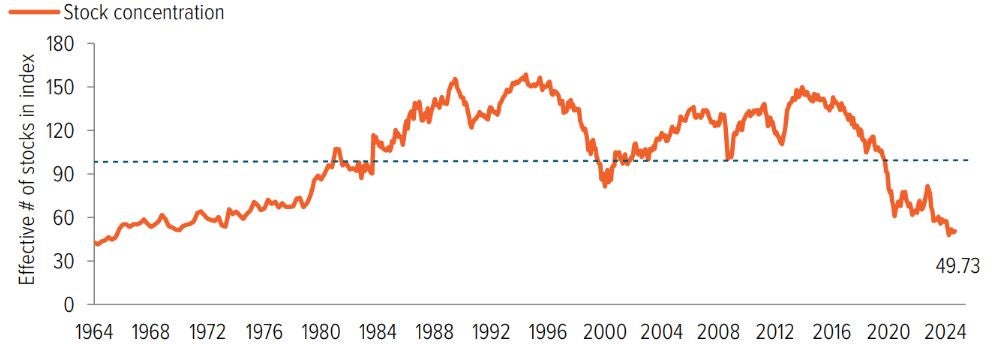
As of 11/24/24. Source: J.P. Morgan.
This concentration raises a critical question: Are passive indexes merely poorly-managed active funds in disguise? Moreover, is the market teetering on the brink of a crash, reminiscent of the late ‘90s tech bubble?
Index concentration alone doesn’t predict a crash
One natural reaction to seeing a high index concentration level is to equate it to a stock market bubble. Anyone who lived through the late 1990s dot-com era probably still carries scars, recalling when companies such as Pets.com, Webvan, and Gadzoox soared before crashing back to earth. With the current enthusiasm around artificial intelligence (AI), is history likely to repeat itself?
You can’t answer that by looking at market concentration alone. Going back to January 2000, you’ll find many examples of concentrated markets delivering strong forward returns (Exhibit 2). If concentration were a factor in stock market crashes, there would be a clear downward trend in the scatterplot below. Instead, positive and negative returns have occurred regardless of concentration level.
So what drives outcomes? Company fundamentals: profitability, revenue, assets, liabilities, and growth potential. Momentum and index concentration may dominate news headlines now, but long-term returns are driven primarily by fundamentals. It is worth noting that while price-to-earnings valuations in the S&P 500 Index have surged, valuations overall are backed by durable economic and secular trends (those that are not seasonal or cyclical) that contribute to growth. Thus, the success of the S&P 500 Index and its massive inflows are not entirely irrational. We could spend hours dissecting recent returns, but the more important question is, “Can these returns continue, or should I diversify?”
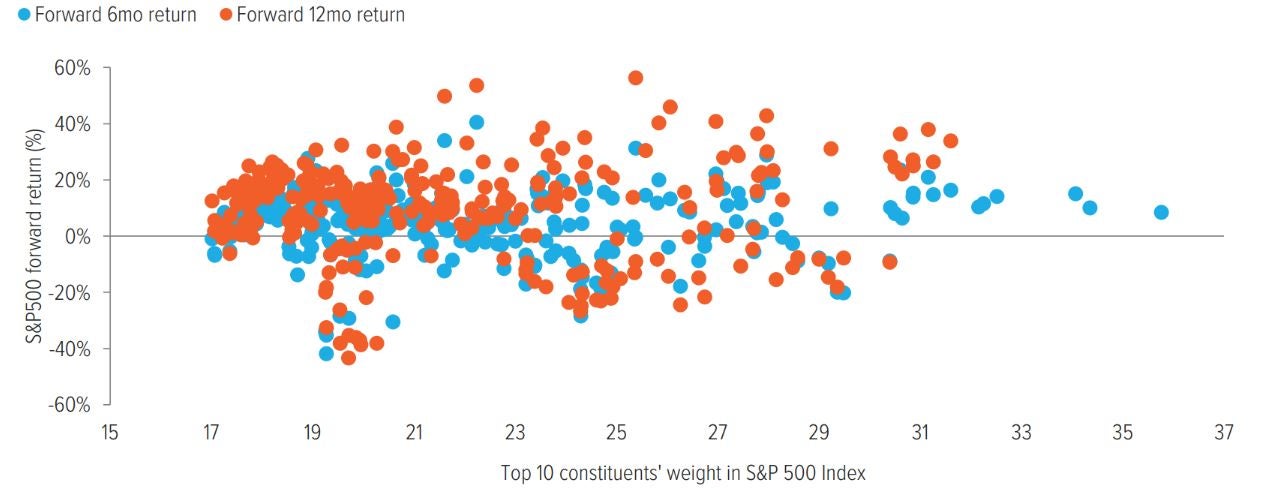
As of 12/31/24. Source: Bloomberg Index Services Ltd., Voya IM. Forward return refers to the expected future rate of return of an investment, often calculated by considering factors such as free cash flow, growth, and inflation. Past performance does not guarantee future results. Investors cannot invest directly in an index.
So … should I diversify?
Far too often, investors view the active versus passive debate as an either/or question. The real question is, “What are my risk/return criteria?” Perhaps your intent really is to tap into the potential growth of mega cap stocks! However, most investors choose a passive approach for broad market exposure. As we demonstrated above, that is no longer the case. The S&P 500 is no longer a truly passive investment—it’s an active bet linked to roughly 50 stocks.
We encourage investors to shift their focus away from the active/passive debate and instead ask the following two questions:
1. Do I want concentrated exposure to mega cap stocks, or do I want true broad market exposure?
2. If I want to diversify beyond mega caps, where should I allocate?
The first question depends on individual investment objectives and should be determined with a client-first mentality. The second question, however, presents some compelling opportunities. Let’s explore four ways to diversify beyond mega cap exposure.
Four ways to diversify beyond mega caps
For true broad equity market exposure, look beyond the S&P 500. Here are four ideas to consider.
1. Look down the company size range
The S&P 500’s market-cap weighting inherently favors the largest companies, and every new dollar invested is allocated to the Index’s current weights, irrespective of the underlying companies’ fundamental outlooks and their stock prices. To manage this exposure, consider exploring U.S. small cap stocks, which offer a more compelling valuation opportunity. Stocks in this segment of the market, especially in the growth universe, are priced at a substantial discount relative to their large cap counterparts, offering potential for higher returns while improving portfolio diversification (Exhibit 3).
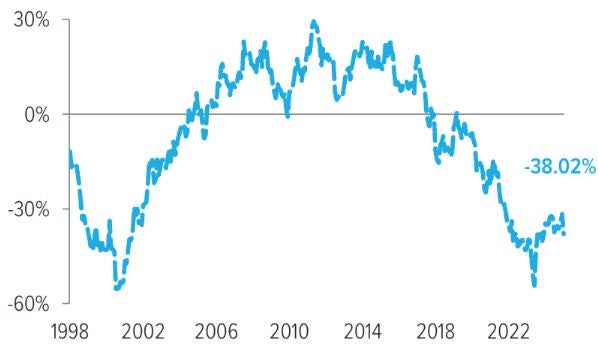
As of 12/31/24. Source: FTSE Russell, Voya IM. Chart depicts the trailing 12-month price-to-earnings ratio based on the Russell 2000 Growth Index (which represents U.S. small cap stocks) and the Russell 1000 Growth Index (which represents U.S. large cap growth stocks). Values above 0 indicate higher small cap growth valuations compared with large cap growth valuations. Values below 0 indicate lower small cap growth valuations compared with large cap growth valuations. Past performance does not guarantee future results. Investors cannot invest directly in an index.
As of 12/31/24. Source: FTSE Russell, Voya IM. Chart depicts the 3-year monthly rolling return of the Russell 1000 Index (which tracks the highest-ranking 1,000 stocks in the Russell 3000 Index, an index that represents about 98% of the value of all U.S. equities). Past performance does not guarantee future results. Investors cannot invest directly in an index.
2. Explore value investing
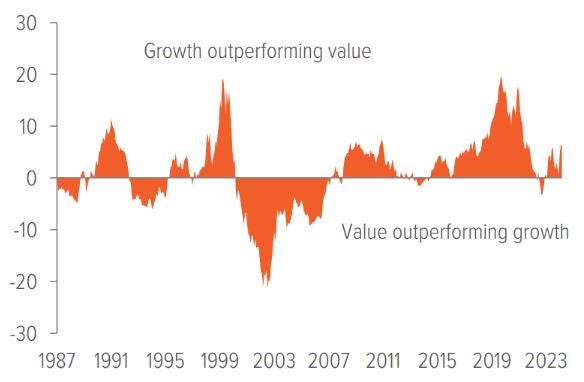
While New York City bars are hosting Nvidia earnings watch parties, the stocks of value-oriented companies are often forgotten. However, they remain an essential component of true broad market exposure. Value stocks have several tailwinds in their favor in 2025, particularly given structural inflation and potential challenges facing traditional growth stocks. Ignoring value could mean missing out on critical diversification benefits. Market leadership of growth and value stocks has fluctuated over the years, which is why a diversified portfolio should include both styles (Exhibit 4).
3. Get active in growth
Rather than defaulting to a cap-weighted index, consider an active or thematic approach linked to AI. While the market remains concentrated, leadership is shifting—offering active managers the opportunity to capture differentiated returns (Exhibit 5). We see some positive signs for active management in 2025— namely, broadening earnings growth, the expansion of AI, and a favorable macroeconomic backdrop. During the fourth quarter of 2024, earnings grew for 10 out of 11 S&P 500 sectors, with 82% of the companies beating expectations. The AI-driven trade is moving beyond clear winners (such as Nvidia). And deregulation, easing monetary policy, and other tailwinds are benefiting the broader market—not just mega caps.
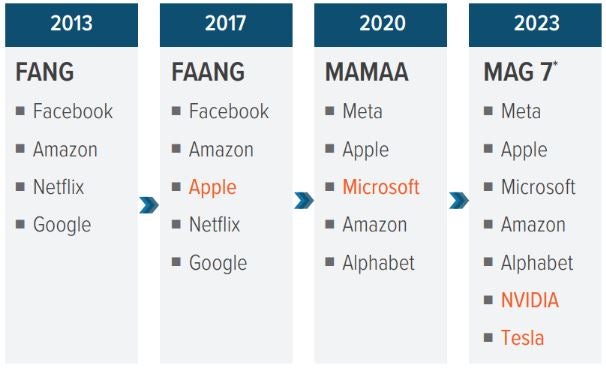
*Can be referred to as Elite 8 including Netflix
Source: Voya IM
4. Pair passive equity funds with a contrarian or equal-weighted strategy
A contrarian strategy (which goes against conventional market trends by investing in out-of-favor stocks) offers a powerful hedge against market concentration. While such a strategy may exhibit higher tracking error and volatility, when combined with passive exposure, it can smooth performance for risk-averse investors. This approach can help mitigate the concentration risk associated with the S&P 500 and provide a more balanced portfolio.
Alternatively, if a contrarian strategy feels too risky, consider a rules-based equal-weighted strategy. These strategies offer two key benefits: diversification across all sectors (not just tech) and disciplined, unemotional rebalancing that systematically buys low and sells high (taking advantage of the currently volatile market).
Bottom line
The S&P 500 Index has shifted from a well-diversified group of stocks to a riskier active bet on a few market giants, and investors seeking true broad market exposure must look beyond it. Whether through small cap growth, active large cap growth, value, contrarian, or equal-weighted approaches, opportunities exist to enhance returns while reducing concentration risk. By developing awareness of this issue and the potential solutions, investors can make more informed decisions that align with their long-term goals and risk tolerance.
A note about risk
All investing involves risks of fluctuating prices and the uncertainties of rates of return and yield. The principal risks are generally those attributable to stock investing. Holdings are subject to market, issuer, and other risks, and their values may fluctuate. Market risk is the risk that securities may decline in value due to factors affecting the securities markets or particular industries. Issuer risk is the risk that the value of a security may decline for reasons specific to the issuer, such as changes in its financial condition. More particularly, growth-oriented stocks typically sell at higher valuations than other stocks. If a growth-oriented stock does not exhibit the level of growth expected, its price may drop sharply. Additionally, growth-oriented stocks have been more volatile than value-oriented stocks. Smaller companies may be more susceptible to price swings than larger companies, as they typically have fewer resources and more limited products, and many are dependent on a few key managers. Artificial intelligence (AI): AI—including natural language processing, machine learning and other forms of AI—may pose inherent risks, including but not limited to: issues with data privacy, intellectual property, consumer protection, and anti-discrimination laws; ethics and transparency concerns; information security issues; the potential for unfair bias and discrimination; quality and accuracy of inputs and outputs; technical failures and potential misuse. Reliance on information produced using AI-based technology and tools should factor in these risk