



Private equity buyout valuations have moved to unusually low levels relative to public equities. For secondaries investors, that gap may expand the number of opportunities where the acquisition price aligns with target returns.
Public and private markets send different price signals
Private equity (PE) secondaries have a long history of outperforming public equities, leading in 18 of the past 21 rolling three-year periods (Exhibit 1). We believe that track record reflects the broader advantages of private equity ownership, including sponsor-led value creation and active governance, with secondaries potentially adding further benefits through seasoned assets, discounted entry points, and a shorter path to distributions.
More recently, however, public equities have taken the lead. AI-related capital spending has driven outsized gains in a narrow group of large cap public companies, lifting public equity valuations even as private equity buyout multiples have moved lower.
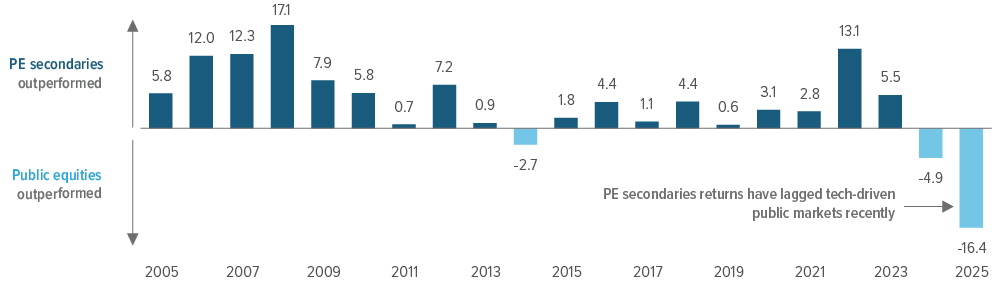
As of 09/30/25 (data lagged 2 quarters). Source: Cambridge Associates, MSCI, Pomona Capital. PE secondaries: Cambridge Secondary Funds Index, which represents secondaries, uses a pooled horizon internal rate of return calculation based on data compiled from 334 secondaries funds, including fully liquidated partnerships, formed between 1991 and 2024. Global equities: MSCI World Index. See back page for important information about the Cambridge Index and additional disclosures.
By the end of 2025, the EV/EBITDA multiple for S&P 500 companies had climbed to 18.7x, while the median multiple for U.S. private equity buyouts dropped to the lower end of its recent range at 11.2x, opening the widest valuation gap in a decade (Exhibit 2). That gap doesn’t guarantee future returns, but it does change the starting point.
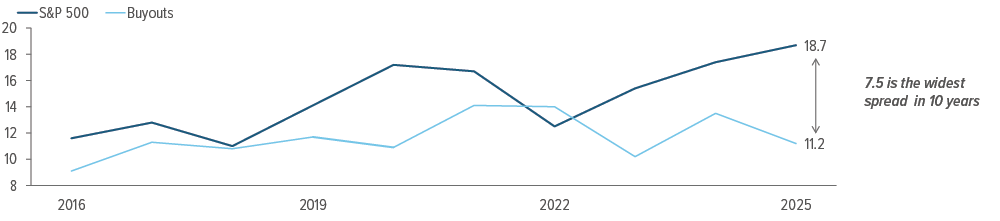
As of 12/31/25. S&P 500 EV/EBITDA from Bloomberg. Buyout valuations represent median entry EV/EBITDA multiples for U.S. private equity buyout transactions, as reported by PitchBook.
Why the valuation gap matters for secondaries
To paraphrase famed GMO co-founder Jeremy Grantham, mean reversion is “the most powerful force in financial markets.” But valuations don’t need to revert immediately to matter: The more investors pay up front, the more future growth must go right.
If public equities are priced for exceptional outcomes, even healthy earnings growth may not be enough to sustain returns. By contrast, lower PE entry valuations may allow investors to generate attractive outcomes with more modest growth assumptions and disciplined exits.
Secondaries add another layer to that edge. Because secondary buyers enter later in the PE lifecycle, many underlying companies are already known, value creation plans are underway, and the path to distributions is shorter than with a new primary fund commitment. That means less reliance on multiple expansion and a greater emphasis on operational improvement, cash flow growth, and value realization.
Downside resilience
Current entry valuations may also further enhance the utility of secondaries in providing a buffer in down markets. Since 2000, PE secondaries funds have participated in 65% of the upside of global equities during positive quarters for public stocks. During down quarters, PE secondaries have produced a slight gain, remaining resilient through market declines (Exhibit 3).
There are important differences between public and private market valuation methodologies, including valuation frequency and reporting lags. Even so, the historical pattern is notable: Secondaries offer exposure to PE growth while potentially improving portfolio resilience.
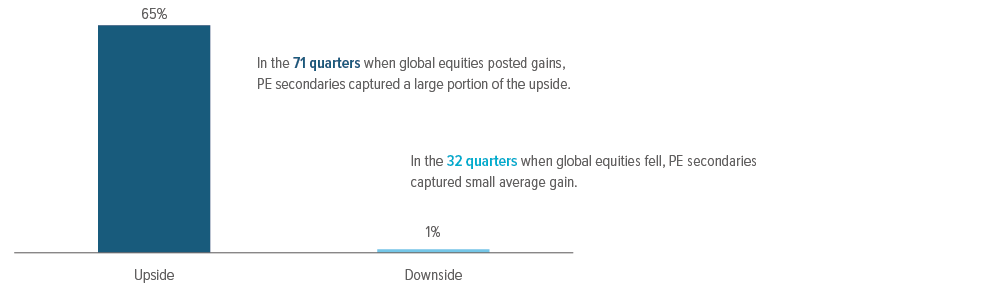
As of 09/30/25. Source: Cambridge Associates, MSCI, Pomona Capital. Upside/ downside capture represents the ratio of the Cambridge Secondary Funds Index cumulative pooled horizon return to the MSCI World Index cumulative return during periods when the MSCI World was positive or negative, respectively. See back page for important information about the Cambridge Index and additional disclosures.
Several features may help explain that pattern. Buying at a discount to NAV can provide a cushion if the corporate environment weakens. Investing later in a fund’s lifecycle may reduce exposure to the early blind-pool phase. And because the assets are more mature, investors may be closer to distributions and realized returns.
How Pomona translates valuation into opportunity
For secondary private equity investors, the valuation question is a practical one: What are we paying today for future cash flows? And does that price support the return we’re targeting?
Public equities are currently priced for a lot to go right, while private equity buyout valuations have moved lower, creating a more favorable starting point.
Pomona’s process starts with fundamentals. The team assesses the timing and amount of cash flow for each investment, working backward from there to determine the price they are willing to pay. At that point, valuation comes into focus, showing whether the discount needed to meet that return is achievable. Those results are viewed through a lens of portfolio analysis and sensitivities to determine an investment’s suitability.
Viewed this way, a wide valuation gap can broaden the opportunity set. When private equity valuations are lower and secondary transactions allow entry at a discount, there are more situations where price aligns with target returns.
Secondaries also bring the practical advantage of visibility. Because these investments often come later in a fund’s life cycle, Pomona can evaluate how companies have actually performed— whether leverage has come down and cash flows are materializing. That makes valuation less about assumptions and more about observed outcomes.
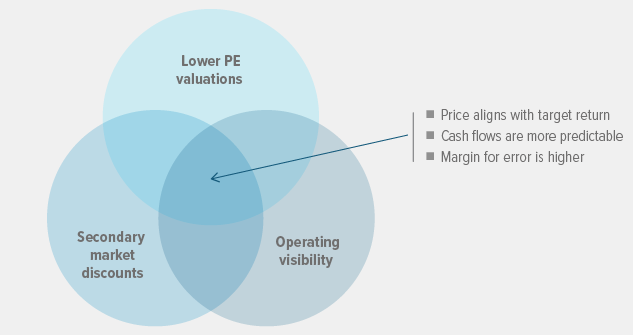
Put together, today’s environment can expand the set of opportunities, enlarging the “sweet spot” of overlap across PE valuations, secondary market discounts, and operating visibility. In an uncertain market, starting from a better price can make a meaningful difference in outcomes.
To learn more, contact your Voya representative or visit PomonaInvestmentFund.com.
A note about risk:
Secondary investments: Risks include the ability of the manager to select and manage successful investment opportunities, the underlying fund risks, and general economic conditions. Secondaries are non-controlling investments. There is no established market for secondaries.
Primary investment: Risks include the ability to identify sufficient investment opportunities, blind pool, the manager’s ability to select and manage successful investment opportunities, the ability of a private equity fund to liquidate its investments, diversification, and general economic conditions.
General private equity risks: Private equity investments are subject to various risks. These risks are generally related to: (i) the ability of the manager to select and manage successful investment opportunities; (ii) the quality of the management of each company in which a private equity fund invests; (iii) the ability of a private equity fund to liquidate its investments; and (iv) general economic conditions. Private equity funds that focus on buyouts have generally been dependent on the availability of debt or equity financing to fund the acquisitions of their investments. Depending on market conditions, however, the availability of such financing may be reduced dramatically, limiting the ability of such private equity funds to obtain the required financing or reducing their expected rate of return. Securities or private equity funds, as well as the portfolio companies these funds invest in, tend to be more illiquid and highly speculative.