


Fixed Income Perspectives: How AI Spending Is Creating a More Selective Market

Head of Multi-Sector Fixed Income

Key Takeaways
AI investment is increasingly being financed in public credit markets, with tech issuers driving one fifth of new investment grade supply in the first quarter.
Unlike past capex booms, today’s biggest AI borrowers are entering from a position of credit strength, with low leverage, high cash balances, and open access to capital markets.
The bigger credit story is not generalized market stress but growing issuer dispersion, as AI spending and disruption create clearer winners and losers across sectors.
As companies look to bond markets to fund AI investment, the credit impact is showing up in more selective ways, creating opportunities for active investors.
Fixed Income Perspectives with Hans Sapra
Funding innovation
One thing is clear from the recent earnings season: the AI spending wave isn’t slowing down. As companies race to meet what OpenAI’s CFO described as a “vertical wall of demand,” capital investment by the four big hyperscalers—Alphabet, Amazon, Meta, and Microsoft—is now expected to hit at least $725 billion, over 70% more than last year’s record.1 Even beyond tech, corporate spending continues to rise broadly, giving the U.S. economy a critical boost.2
Increasingly, the high grade bond market is playing a key role in funding AI investment. New investment grade (IG) issuance in the first quarter was among the strongest on record, with technology issuers accounting for about a fifth of new supply (Exhibit 1). Private credit has expanded as well, stepping in where public markets offer less customization. Across both channels, investors are being asked to finance a front-loaded investment cycle with a delayed and uncertain payoff profile.
This dynamic has raised questions, but so far, markets have absorbed the new supply.
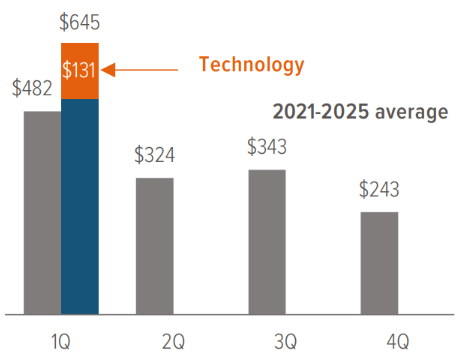
As of 03/31/26. Source: J.P. Morgan.
Why this cycle looks different
A natural instinct is to view rising issuance as a late-cycle warning. More debt shows up, so risk must be building underneath. That was the pattern in the internet boom in the early 2000s, the global financial crisis in 2008, and the shale-driven investment surge in the mid-2010s (Exhibit 2). But it doesn’t map cleanly to what’s happening now.
Today, the companies driving much of the incremental issuance are entering the market from a position of strength. Hyperscalers in particular exhibit some of the strongest credit metrics across the IG landscape, with low leverage, high cash balances, and higher median credit ratings (Exhibit 3). Market access remains open and issuance well absorbed. And where spreads have adjusted, they have largely reflected supply digestion and long-term cash flow uncertainty, not credit stress.
Technology spreads have widened, but the magnitude of the move so far is relatively subdued next to past capex-driven cycles. And the pressure is showing up in more targeted ways, affecting not only technology companies, but also insurers, utilities, business services, advertising, and more.
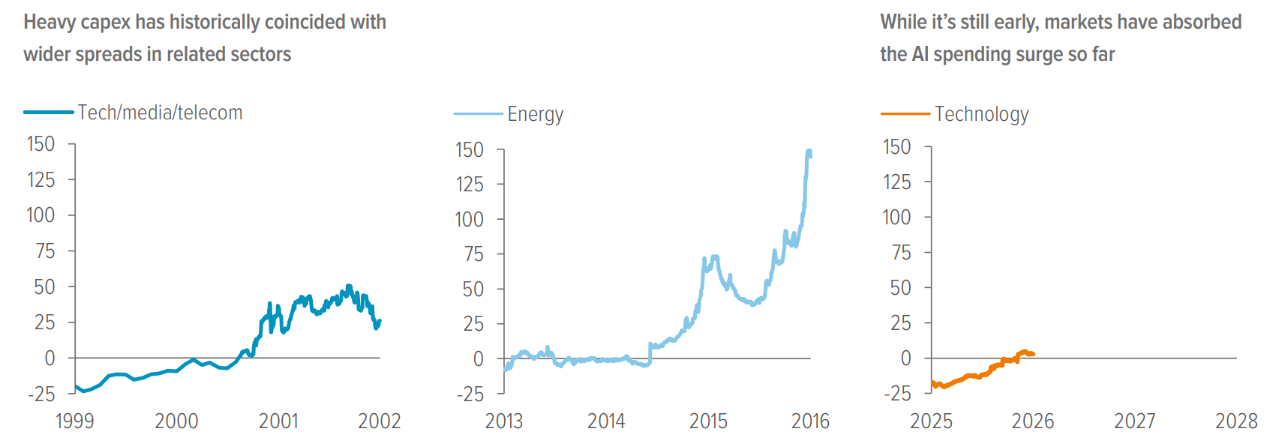
As of 03/31/26. Source: Bloomberg, Voya IM.
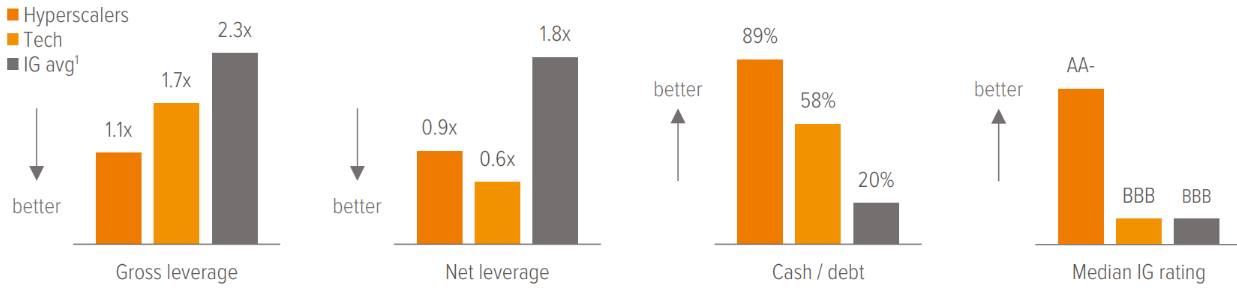
As of 12/31/25. Source: Bloomberg, Morgan Stanley Research, FactSet, ICE BAML, Voya IM. 1. Bloomberg U.S. Investment Grade Index, excluding financials.
A more selective market, not a more dangerous one
The combination of heightened issuance and uneven pressure from capital spending is creating attractive conditions for active investors in the form of wider dispersion. Issuers in the same industry are often showing very different risk profiles depending on their business model, balance sheet, and exposure to AI disruption. (See sidebar: A framework for AI disruption.) The result is that spreads are moving less in unison and performance is increasingly issuer specific.3 In this environment, a manager’s ability to differentiate between issuers with durable business models and those more exposed to emerging risks is key to capturing income while managing downside.
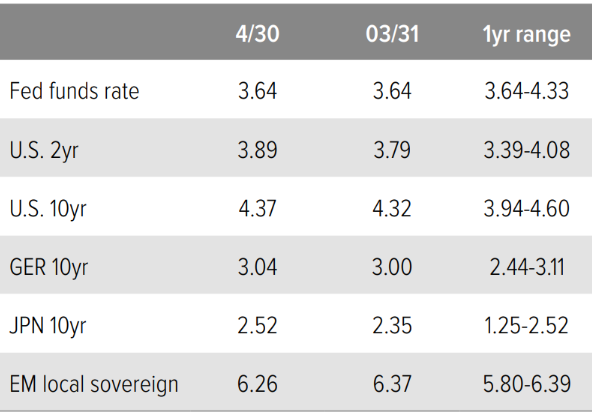
As of 05/21/26. Source: Bloomberg, FactSet, Voya IM.
A framework for AI disruption
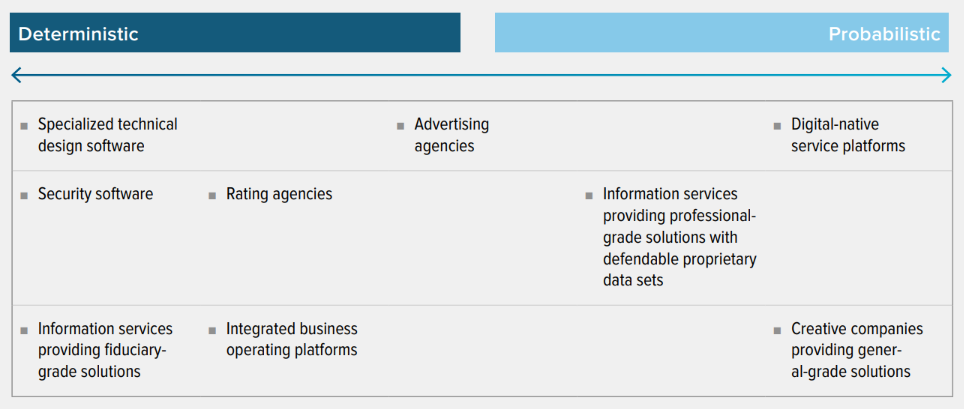
One area most under pressure is software and adjacent sectors, where AI disruption is reshaping competitive dynamics. A useful way to think about relative vulnerability is to map businesses along a continuum based on the nature of their output—specifically, how precise the outputs need to be and the consequences of getting it wrong.
Deterministic systems run workflows such as accounting, tax, compliance, or security. They define what’s true inside an enterprise and create auditable outcomes. Errors carry real financial, legal, or reputational consequences, so customers demand reliability, governance, and consistency.
Probabilistic systems rely on pattern recognition and are used in areas like search, content creation, or design. Outputs don’t have to be perfect to be useful, and some variability is acceptable. Speed and flexibility matter more than precision.
Harder to displace / more stable cash flows
- Higher switching costs
- Deep customer workflow integration
- Strong regulatory and trust requirements
- Reliance on accuracy and control
Greater disruption risk / competitive intensity
- Lower barriers to entry
- Outputs can be more easily replicated or improved by newer AI models
- Alternative uses create pricing pressure
Why it matters for fixed income investments: Risk profiles for two issuers in the same industry can be very different. In this example, we would tilt toward more deterministic business models when faced with a like-for-like credit decision. This framework is most useful at the business model level rather than picking winners purely on their technology.
Sector outlooks

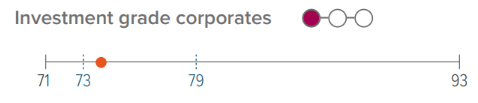
- Spreads widened on earlier heavy issuance but have since rallied back, leaving valuations back near recent tight levels and limiting upside.
- Solid earnings growth and healthy margins signal strong corporate fundamentals, but demand remains sensitive to rate volatility and geopolitical headlines.
- New supply could create periodic pressure, even as higher yields continue to draw in buyers.
- With excess return potential more limited, we remain cautious until better entry points emerge.
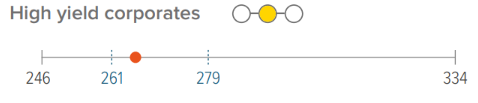
- Spreads have tightened back toward historically rich levels, limiting upside and leaving less room for the market to absorb idiosyncratic or macro disappointments.
- Income remains the primary driver of returns, supported by solid balance sheets and still-low default expectations.
- Performance is increasingly issuer specific, particularly across lower-quality credits and sectors exposed to AI disruption or cyclical pressures.
- Market tone remains “buy-the-dip,” but selectivity is critical as upside from spread compression is limited.

- Loan markets have rebounded with broader risk assets, supported by stable fundamentals and improved sentiment.
- Demand remains supported by institutional buyers, with CLO issuance expected to pick up after a slower period.
- Differences across sectors and credit quality are becoming more pronounced, creating a more selective environment.
- Maintain exposure but prioritize higher-quality issuers. Be mindful of areas exposed to structural risks.
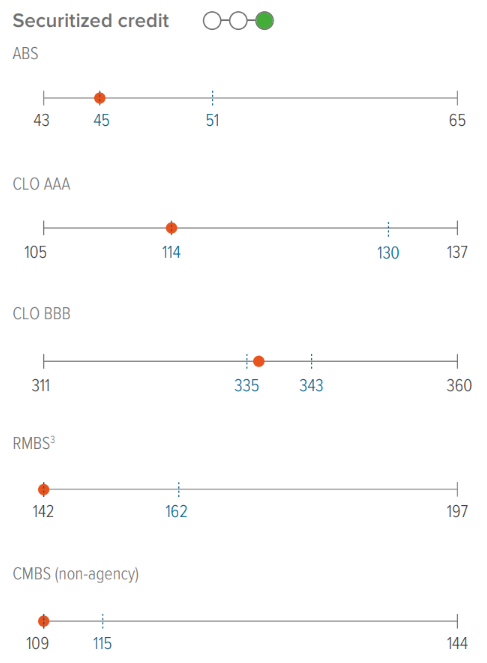
- Spreads tightened in April but did not fully keep pace with other credit sectors, leaving opportunities in select areas.
- Better technicals, especially in CLOs, are helping support the market, though sentiment remains cautious amid AI-related risks.
- CMBS fundamentals are improving, supporting a more constructive outlook, while consumer credit remains mixed.
- Focus on areas with stronger fundamentals and clear relative value opportunities rather than broad exposure.
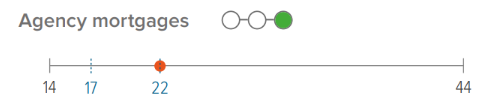
- MBS have sold off in response to the move higher in rates, bring relative value back in play.
- Supply remains relatively limited, which helps support the market, even in a volatile rate environment.
- Demand will depend in part on policy and regulatory clarity, with potential support from government-related programs.
- Continue to view as a defensive allocation but expect performance to remain tied to interest rate volatility.
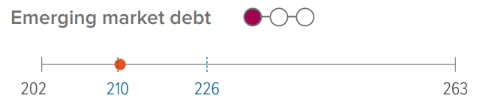
- EM debt rebounded following the Iran ceasefire, reversing much of the prior spread widening and outflows.
- Valuations are now less attractive, with spreads closer to historically tight levels.
- A stronger dollar, higher energy prices, and tighter financial conditions remain ongoing headwinds.
- Stagflation risk and constrained central bank flexibility reinforce a cautious, selective approach.