


Multi-Asset Perspectives: Scarcity Sets the Terms

CIO, Multi-Asset Strategies and Solutions

Key Takeaways
The global economy is still growing but has less room for error. U.S. growth remains resilient for now, helped by private investment, government spending, and services, although momentum may slow later this year as government support fades.1
Inflation isn’t spiking, but it isn’t returning easily to its pre-pandemic level. Tariffs, supply chain redundancy, swings in energy prices, and steady wage growth should keep the Federal Reserve patient and limit how much it can cut interest rates.2
The labor market is stable. Hiring has cooled and fewer Americans are working or looking for work, but unemployment remains low and wage pressure is easing.3
Markets can still rise, but it’s all going to be earnings driven. Stocks are expensive, investors are earning little extra for lending to companies, and the Fed isn’t cutting interest rates. Returns will lean more on actual earnings and healthy business fundamentals than on higher stock valuations.
Growth now takes far more investment than it used to. Trade is reorganizing, energy risks are rising, and inflation lingers. In this environment, investors are willing to pay more for scale, productivity, and reliable income.
Economic growth (moderating)
The U.S. economy grew at an annualized rate of 2.7% in the first quarter of 2026. Strong spending on services and steady business investment made up for early signs that consumers were pulling back.
For the second quarter, forecasters expect growth near 2.2%, which represents a modest slowdown but a still-healthy pace. Higher borrowing costs and earlier spikes in energy prices are starting to weigh on what households spend.1
Fundamentals (positive)
S&P 500 companies earned about 29% more in the first quarter of 2026, year over year, marking six straight quarters of double-digit growth, powered by strong technology profits and companies keeping more of each sale as profit. Nine of the eleven sectors grew; technology, industrials, and materials led, while energy and utilities lagged.
Early estimates for the second quarter point to earnings growth of about 23%. If that holds, it would be the second straight quarter above 20%.4
Valuations (stretched)
U.S. stocks still look expensive compared with the past, especially among large companies, whose share prices are now about 20 times their expected earnings. Strong profit growth has pulled those valuations down from their early-2025 highs, although stocks still aren’t cheap.
Outside the U.S., stocks are cheaper although no longer true bargains: Europe and parts of emerging markets (EM) have gotten more expensive over the past 15 months. The S&P 500, by contrast, has risen mainly because earnings grew.5
Sentiment (constructive, watch positioning)
Investors are still feeling good about the market. Money keeps flowing into stocks, and optimism is running above average.
But two things are worth watching: Investors are crowding into the same trades, and they’re borrowing more to do it. Historically, this positioning has often come before a spike in volatility. If company earnings or the economy start to weaken, that crowding could reverse fast and push prices down.
Portfolio positioning
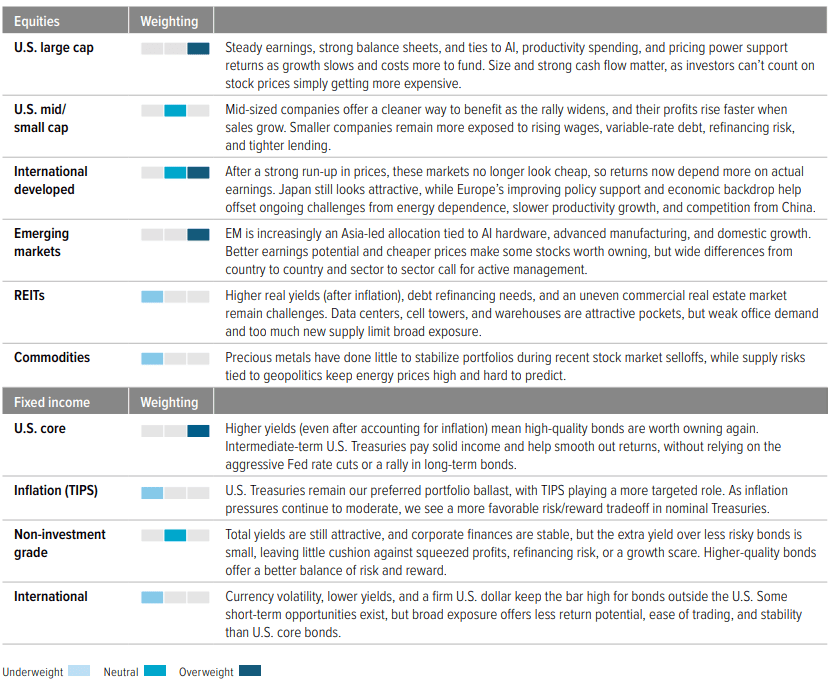
We are modestly biased toward stocks over bonds, with a slight preference for U.S. large cap equities and high-quality fixed income.
Macro backdrop
The new cost of growth
Investment is carrying growth now. That marks a significant shift from the last cycle, when investors could lean on low inflation, falling rates, abundant labor, and increasingly efficient global supply chains. Today’s economy is powered by spending on AI, energy security, government support, defense, reshoring, and automation. Those are real sources of growth, but they take heavy upfront investment and are vulnerable to higher borrowing and material costs.
But this wave of investment isn’t spread evenly. Data centers, power demand, and cloud spending remain bright spots, while broader factory construction has lost momentum.
That unevenness is exactly why selection matters. We want to own the parts of the investment universe where earnings, balance sheets, and productivity gains are strongest.
The U.S. remains the strongest developed market growth story. Business investment and government spending pushed first-quarter gross domestic product (GDP) growth up to 2.7% from the prior quarter.1 That mix should keep growth steady in the near term. But as government support fades toward year-end, the economy will lean more on consumers to keep growth going—and consumers are the bigger question mark.
American consumers are still spending, but the cushion is thinner and increasingly divided. Higher-income households are keeping overall spending up, while lower-income households feel more of the squeeze from food, energy, and borrowing costs.
The job market tells a similar story. The U.S. economy added just 57,000 jobs in June, but unemployment at 4.2% still points to a labor market near full strength. Fewer people are working or looking for work—a sign that slower hiring reflects both weaker demand for workers and a smaller supply of them. That keeps wage pressure firm and limits the kind of sharp labor market break that would normally force the Federal Reserve to cut interest rates quickly.
Inflation and policy: The Fed has less room to cut if inflation stays sticky
Inflation is still what’s tying the Fed’s hands, even if the picture is more mixed than the headline numbers suggest. The main inflation gauges (the Consumer Price Index and the Fed’s preferred personal consumption expenditures measure) are still running high, but lower tariff rates and calmer market pricing suggest investors aren’t betting on a lasting inflation spike.
Under new Fed Chair Kevin Warsh, the central bank has shifted its approach. Warsh has said he doesn’t think the Fed should tip its hand about future rate moves, preferring to react to the data as it comes in. The Fed is also paying closer attention to inflation measures that strip out the largest price swings in both directions (Exhibit 1). Those measures keep edging toward the Fed’s 2% inflation target, in line with the restrained inflation swap pricing shown in the chart.
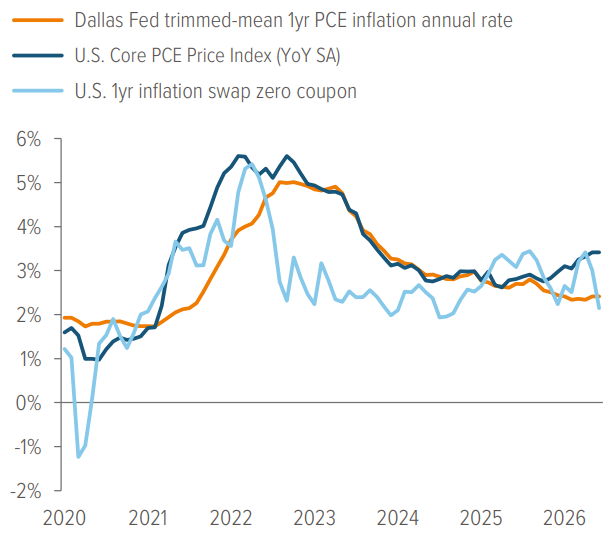
As of 06/30/26. Source: Bloomberg. Core PCE measures consumer inflation excluding food and energy. Dallas Fed trimmed-mean PCE is an inflation measure that removes unusually large price moves to better capture the underlying trend. 1yr inflation swap measures the market-implied expectation for inflation over the next year.
Still, we expect inflation to return to the Fed’s 2% target over the next 18 months. However, the path is likely to be uneven as tariffs, supply chain realignment, higher defense spending, and the costs of expanding U.S. manufacturing keep price pressures elevated. This is not a replay of 1970s-style stagflation: The U.S. is less vulnerable to oil shocks, and economic growth and corporate profits remain healthy. Even so, inflation may stay volatile enough to keep the Fed cautious.
The Fed is holding its key rate at 3.50%–3.75%, and we expect it to stay patient until it sees clearer signs of either weaker economic growth or fresh inflation pressure. In this environment, bonds look more attractive than cash, and we favor companies that can raise their prices over those that simply need lower rates to do well.
Global trade and geopolitics: Trade moves closer to home
Global trade continues to shift from “cheapest is best” to “safest is best,” as countries develop supply chains closer to home. This isn’t the end of global trade, but it’s less efficient than the former approach. Tariffs and backed-up supply chains push prices up slightly. Spending on automation, extra inventory, shipping, and regional production adds to business investment. And all of it rewards size, favoring large companies that can raise prices and can afford the technology to adapt.
This effect is uneven across regions. The U.S. benefits from its own energy production, deep financial markets, and its innovation leadership, while Europe and Japan lean more on imported energy and face tougher trade competition. EM Asia benefits from demand for hardware and advanced manufacturing but remains exposed to volatility in the U.S. dollar and oil prices (Exhibit 2).
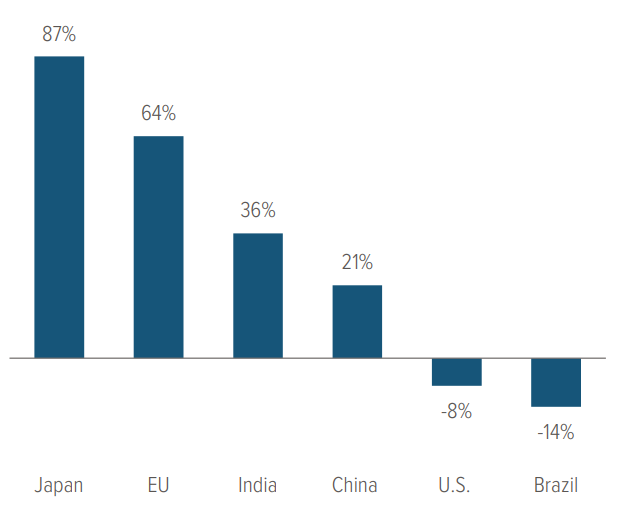
As of 03/31/26. Source: IEA, Goldman Sachs Asset Management.
Geopolitical conflict still drives volatility, particularly for countries that depend on oil shipped through the Strait of Hormuz. But recent events—the 2025 tariffs and Russia’s invasion of Ukraine in 2022—show that the fear priced into markets can fade quickly once worst-case outcomes become less likely.
The overall effect still drags on global growth, but less so for the U.S., thanks to its energy supply, innovation, deep markets, robust profits, and strong domestic demand. We aren’t backing away from stocks because of trade friction or geopolitical risk. We just favor the regions and companies best insulated from those risks— those with pricing power, home-driven demand, and less exposure to fragile supply chains.