

What happens when AI stocks and the rest of the market stop reacting to Treasury yields the same way? It may say something about what investors are worried about.
For much of the past year, AI stocks and the rest of the S&P 500 both tended to move opposite to the 10-year Treasury yield. One way to see this is to compare how each has reacted to changes in the yield.
Then October happened. AI stocks began to separate from the rest of the market around October 5. That was when strong September factory and service-sector activity surveys from the Institute for Supply Management were followed by reports showing faster price increases for both consumers and producers. The Goldman Sachs U.S. Broad AI basket hit a local peak on October 6, although it stayed below its June highs. The 10-year U.S. Treasury yield also peaked around the same time.
Since then, the gap has been hard to ignore. As of November 16, the correlation between AI stocks and changes in the 10-year Treasury yield was about +0.49. For the S&P 500 excluding AI, it was about -0.45, still negative. Correlation runs from -1 to +1. A positive score means two things tend to move together, and a negative score means they tend to move in opposite directions. This shows how they have moved, not why.
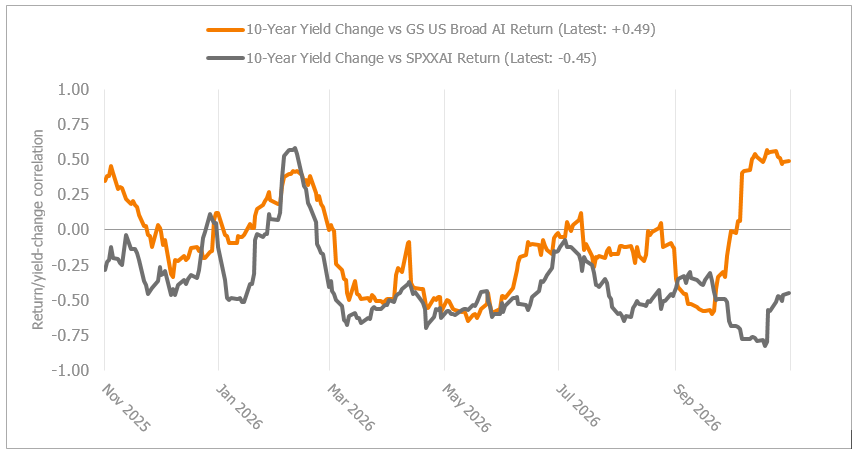
Source: Bloomberg. GSTMTAIP Index, SPXXAIS Index, USGG10YR Index. Correlation runs from -1 (opposite directions) to +1 (move together). The chart above uses daily data from November 17, 2025, to November 16, 2026, over a rolling 21-observation window.
So, what changed?
The 10-year Treasury yield reflects a mix of expectations about economic growth, inflation, and monetary policy. So the way stocks react when yields change can offer clues about which of those forces investors are focused on most.
At first, the October divergence suggested that the market may have shifted its focus from inflation to the possible effects of tighter monetary policy on growth. The Fed had raised rates in September, and inflation readings had come in hotter. Investors had reason to think more tightening could be coming. The question may have changed from How high will inflation keep rates? to What will higher rates eventually do to growth?
The behavior of the broader market was consistent with that view. The correlation between the S&P 500 excluding AI and changes in the 10-year yield has stayed negative, including through the November midterm elections. Other data added context, including asset managers’ positioning in 10-year Treasuries in CFTC data and the performance of ex-AI indexes and more defensive sectors.
Put another way: The broader market seemed more worried about growth, which fits with investors rotating into 10-year Treasuries and defensive sectors.
Then the data complicated things. Since the midterms, a hot jobs report and another hot consumer-price index reading have come with a rise in the 10-year yield. That makes the earlier explanation less clear-cut.
Investors may now be asking whether the pause in October fit with the inflation picture, and whether more rate hikes will be needed. Fed commentary has also become more hawkish, meaning it leans toward higher rates, with three hikes now priced in for next year. At the same time, greater confidence in the Fed and Chair Warsh, along with continued drops in oil prices, could allow Treasury yields and AI stocks to stay positively correlated.
Or the balance of worries could shift again. If growth worries start to carry more weight, the stock-bond correlation could move back toward the negative relationship we saw in the years before the 2022 sell-off. In that scenario, bonds could once again serve as a more reliable hedge for equities.
That’s why we would be careful about treating the recent divergence as a new market rule. The window of data is short, the numbers are moving fast, and the forces pushing Treasury yields around change with almost every major economic release.
When yields move, AI stocks and the rest of the market may not react the same way. That can help frame conversations with clients about how rate moves are showing up in their portfolios, and the pattern can change quickly.
Advisor angles
Aren’t higher interest rates supposed to hurt AI stocks?
They can. Higher rates reduce what profits expected far in the future are worth today, which is why growth stocks have tended to struggle when rates rise. But it depends on why rates are rising. U.S. Treasury yields can move higher because of stronger growth expectations, persistent inflation, tighter Fed policy, or some combination of the three. The recent link between AI stocks and yields doesn’t mean higher rates are no longer a problem for AI stocks.
What does a positive correlation between AI stocks and Treasury yields actually tell me?
It tells you how often the two have moved in the same direction over a short stretch. Here, that stretch is about a month of daily data. It doesn’t tell you that yields are driving AI stocks, or that the pattern will hold. Treasury yields reflect expectations for growth, inflation, and Fed policy, and the mix can change with each major data release.
Source: Bloomberg, CFTC, Goldman Sachs