GNMA: The Bond Category for Bad Quarters

Co-Head of Client Portfolio Management, Fixed Income

Portfolio Specialist, Fixed Income

Government-backed mortgage bonds have outperformed during some of the market’s worst quarters. Here’s how they work and what their track record has historically meant for investors seeking diversification.
When markets get choppy, the standard advice is to move toward safety. But “safe” is a complicated word in fixed income. Cash offers little growth potential. Short-term bond funds keep duration low, but often lean into credit to maintain yield. And while U.S. Treasuries have essentially no credit risk, they come with some of the lowest yields in the investment grade universe.
One category tends to get overlooked in that conversation: GNMA bonds.
It starts with a guarantee
GNMA stands for the Government National Mortgage Association—most people know it as Ginnie Mae. Since 1968, GNMA bonds carry the explicit full faith and credit guarantee of the U.S. government—the same backing as a U.S. Treasury bond. When government-insured home loans are pooled into a GNMA bond, that guarantee ensures the timely payment of principal and interest to investors.
The yield comparison below highlights the opportunity. At the end of April 2026, GNMA bonds were offering roughly 90 basis points more yield than 5-year Treasuries and 54 basis points more than 10-year Treasuries, with minimal credit risk.
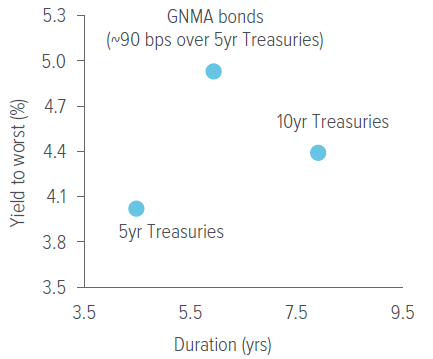
As of 04/30/26. Source: Bloomberg Index Services, Ltd., Voya IM. GNMA bonds represented by the Bloomberg GNMA Index. 5yr and 10yr Treasuries represented by the Bloomberg Bellwether Indices. Yield to worst is the minimum yield that an investor can expect to receive on a bond, considering all possible call or repayment dates. Duration is the number of years it takes to recoup a bond’s true cost, based on the present value of all future coupon and principal payments. Past performance is no guarantee of future results. Investors cannot invest directly in an index.
The boring bond that has held up
GNMA bonds’ yield advantage is just one part of the picture. Another aspect of GNMAs investors may find attractive is how they behave when equity markets don’t.
Since 2000, the S&P 500 has posted negative returns in 31 of 105 quarters. During those same 31 quarters, GNMA bonds turned in positive returns 23 times. They also outperformed the average short-term bond fund in 21 of those down quarters and the average ultrashort bond fund in 21 as well.
Notably, GNMAs had positive returns in periods of extreme volatility such as the global financial crisis and Covid, when both ultrashort and short-term bond fund peer groups had losses. The notable exception was 2022, when high inflation hit virtually every fixed income category, GNMAs included.
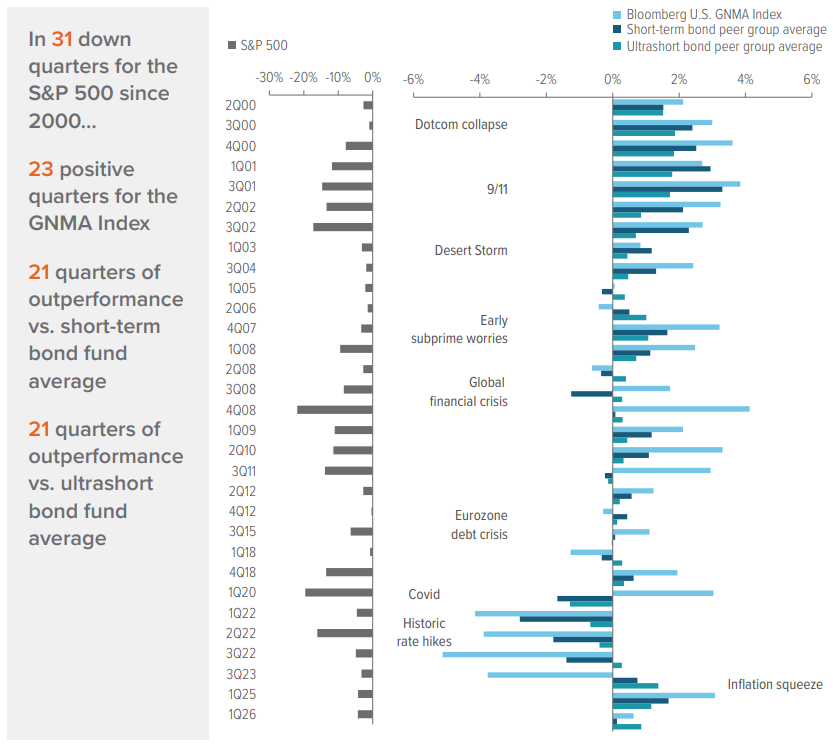
As of 03/31/26. Source: Standard & Poor’s, Morningstar, Voya IM. Past performance does not guarantee future results. Investors cannot invest directly in an index. See back page for definitions and important disclosures.
The unexpected upside of high mortgage rates
For years, GNMA bonds came with a complication: when interest rates fell, homeowners refinanced. That wave of early repayments was good for homeowners but less favorable for GNMA investors, who got their principal back faster than expected and had to reinvest it at lower rates.
That dynamic has largely eased. After the low-rate era following the Covid pandemic, millions of homeowners locked in mortgages at rates well below where they sit today. Most of them have no financial incentive to refinance; rates would need to fall substantially before that calculus changes. GNMA bonds backed by these loans are likely to behave more predictably than they did during the refi-heavy years of the previous decade.
Exhibit 3 tracks 30-year mortgage rates alongside prepayment risk in GNMA bonds. When mortgage rates were low and refinancing made financial sense, homeowners paid off their mortgages early— which meant GNMA investors got their principal back faster than expected and had to put that money back to work in a low-rate environment. When rates rose sharply, the opposite happened: repayments slowed, and investors had less capital to reinvest at the higher rates available.
The current environment is different: slow repayment is already expected, so a modest increase in rates matters less than it once did. A rate decline, meanwhile, would need to be significant before most homeowners decide to refinance. Prepayment risk peaked during the low-rate years of 2020 and 2021, then fell sharply as mortgage rates surged, and has remained relatively subdued since. What this means for investors: the yield advantage GNMA bonds carry over Treasuries now comes with less of the uncertainty that historically complicated it.
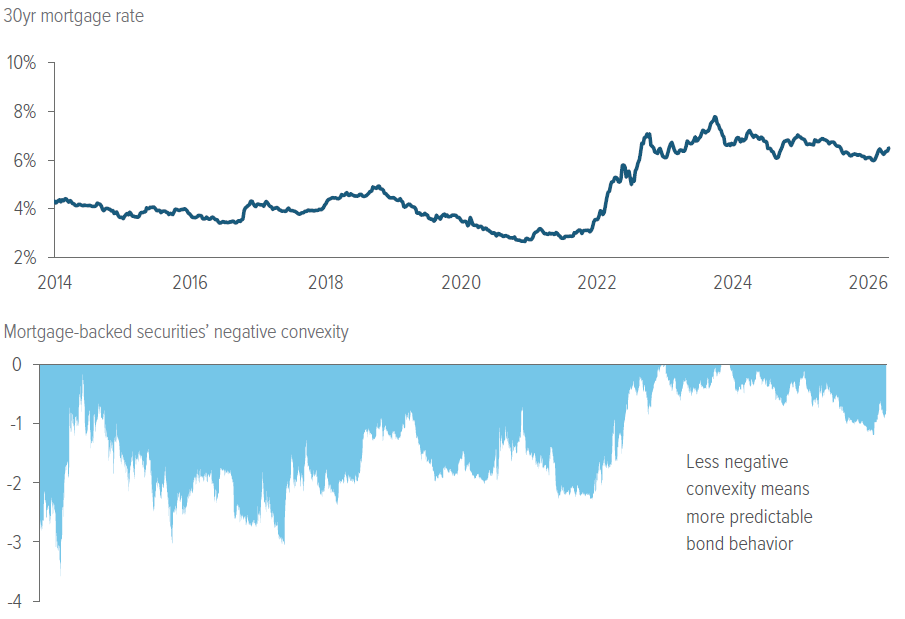
As of 04/29/26. Source: Freddie Mac (Primary Mortgage Market Survey), Bloomberg Index Services, Ltd. Negative convexity occurs when a bond’s duration increases in conjunction with an increase in yield. The bond price will drop as the yield grows. When interest rates fall, bond prices rise; however, a bond with negative convexity diminishes in value as interest rates decline. When rates are higher and refinancing slows, GNMA bonds behave more like traditional bonds, with more stable and predictable price movement.
The rest of the low-risk shelf
When investors want safety, they tend to reach for the same three things: cash, short-term bonds, or Treasuries. GNMAs rarely come to mind first. Here’s how they compare.
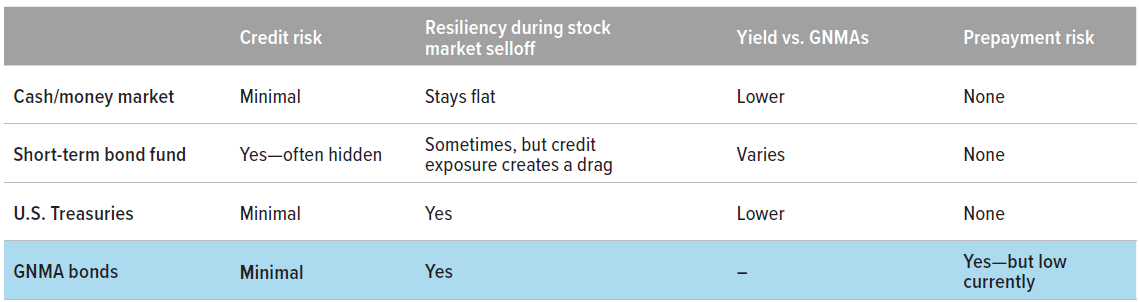
U.S. Treasuries are the closest comparison; both carry minimal credit risk. The difference is yield: GNMA investors receive additional yield in exchange for taking on prepayment risk. Given today’s rate environment, that risk appears lower than it has been for much of the past decade, while the yield advantage remains.
Voya’s approach
The Voya GNMA Income Fund (Class I: LEINX) has been investing in government-backed mortgage securities for more than 30 years, making it one of the oldest funds of its kind. The Fund focuses on GNMAs positioned to hold up as interest rates and prepayment conditions shift.
GNMAs won’t be right for every portfolio or every moment. But 23 positive quarters out of 31 difficult periods is a record that may stand up to scrutiny—not a promise about what comes next, but a reasonable place to start paying attention.
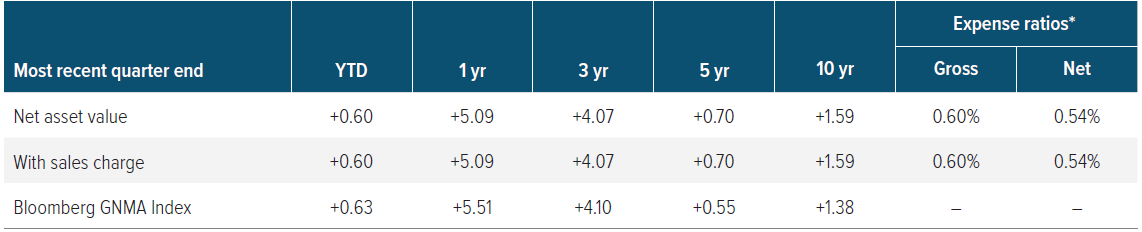
As of 03/31/26. Class I Inception Date: January 7, 2002. Current Maximum Sales Charge: 0.00%.
The performance quoted represents past performance and does not guarantee future results. Current performance may be lower or higher than the performance information shown. The investment return and principal value of an investment in the Portfolio will fluctuate, so that your shares, when redeemed, may be worth more or less than their original cost. For performance information current to the most recent month-end, please visit www.voyainvestments.com. Returns for the other share classes will vary due to different charges and expenses. Performance assumes reinvestment of distributions and does not account for taxes.
An investor should consider the investment objectives, risks, charges and expenses of the Fund(s) carefully before investing. For a free copy of the Fund’s prospectus, or summary prospectus, which contains this and other information, visit us at www.voyainvestments.com or call (800) 992-0180. Please read the prospectus carefully before investing.
* The Adviser has contractually agreed to limit expenses of the Fund. This expense limitation agreement excludes interest, taxes, investment-related costs, leverage expenses, and extraordinary expenses and may be subject to possible recoupment. Please see the Fund’s prospectus for more information. The expense limits will continue through at least 08/01/26 12:00 a.m. Expenses are being waived to the contractual cap.
A note about risk: All investing involves risks of fluctuating prices and the uncertainties of rates of return and yield inherent in investing. You could lose money on your investment and any of the following risks, among others, could affect investment performance. The following principal risks are presented in alphabetical order which does not imply order of importance or likelihood: Credit; Derivative Instruments; Environmental, Social, and Governance (Fixed Income); Interest Rate; Liquidity; Market Disruption and Geopolitical; Mortgage-and/or Asset-Backed Securities; Other Investment Companies; Prepayment and Extension; Portfolio Turnover; Repurchase Agreements; Securities Lending; U.S. Government Securities and Obligations; When-Issued, Delayed Delivery and Forward Commitment Transactions.
Investors should consult the Fund’s Prospectus and Statement of Additional Information for a more detailed discussion of the Fund’s risks. While the Fund invests in securities guaranteed by the U.S. government as to timely payments of interest and principal, the Fund shares are Not Insured or Guaranteed. Investors should consult the Fund’s Prospectus and Statement of Additional Information for a more detailed discussion of the Fund’s risks. An investment in the Fund is not a bank deposit and is not insured by the Federal Deposit Insurance Corporation, the Federal Reserve Board, or any other government agency.