


The chart everyone’s sharing leaves out the one number that stands out this year.
Sometime this week, a client is going to ask you whether the election changes anything for them.
Every advisor has seen the same chart: a single line rising from Election Day, showing that the S&P 500 Index has gained in the 12 months after the 18 midterms since 1954. The weakest year that followed was 1986, up about 3% with a crash in the middle; the typical year was closer to 17%.
A different way to read those 18 midterms is by where the market stood around each midterm election. Four important factors matter: inflation, the fed funds rate, the 10-year U.S. Treasury yield, and how much investors were paying for a dollar of company earnings.
On the first three measures, this year is unremarkable. Inflation is about 3.7%, the fed funds rate is at 3.75%, and the 10-year yield is near 5%. On rates and inflation alone, 2026 closely matches 1966, 1998, and 2006. The S&P 500 returned roughly 18%, 23%, and 7% in the 12 months that followed, respectively.
But on valuation, 2026 is the outlier. Stocks go into this election at about 40x their average earnings over the past decade. On 17 of the 18 prior midterms, that number was between 8x and 31x. On the other, in 1998, it was 37x. Stocks gained roughly 23% over the next 12 months, but high starting valuations have historically been associated with much weaker returns.
Looking across every month since 1954, the more expensive stocks have been relative to their earnings, the weaker the following ten years have tended to be.
So when that call comes: yes, stocks have gone up after every midterm since 1954. But only one of those 18 prior midterms came close to today's valuation: 1998, when stocks were priced at 37x earnings. For a ten-year plan, where stocks are starting from may matter a lot more than what happens on Election Day.
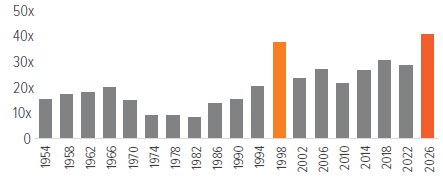
Source: Robert Shiller, Yale University; Voya Investment Management. CAPE (cyclically adjusted price-to-earnings ratio) measures the S&P 500 price relative to the prior 10 years of inflationadjusted earnings. Data shown represent CAPE levels around each midterm election. 2026 data are as of October 2026. Past performance does not guarantee future results.
For the client conversation
- What return does the plan assume for the next ten years, and where did that number come from?
- If the next decade looks more like the one after 1998 than the one after 2008, does the plan still work?
- What would we change in the portfolio because of this election that we wouldn’t change in any other year?
A note about risk: The principal risks are generally those attributable to stock investing. Holdings are subject to market, issuer and other risks, and their values may fluctuate. Market risk is the risk that securities may decline in value due to factors affecting the securities markets or particular industries. Issuer risk is the risk that the value of a security may decline for reasons specific to the issuer, such as changes in its financial condition. All investing involves risks of fluctuating prices and the uncertainties of rates of return and yield inherent in investing.